
QTc: So many formulae, but which one to use?
Introduction
When caring for the poisoned patient, it is essential to rapidly detect dysrhythmias or to determine the risk of the patient developing a dysrhythmia. One effect many drugs, both pharmaceutical and recreational, have on the heart is to prolong the QT interval. The QT interval corresponds to the time period from ventricular depolarization and contraction to ventricular repolarization and relaxation.
There are many drugs associated with QT prolongation including but not limited to methadone; several classes of antimicrobials; antifungals; antiretrovirals; antiemetics; antipsychotics; and class IA, IC, and III antidysrhythmics. Several electrolyte disturbances can also prolong the QT interval including hypokalemia, hypomagnesemia, and hypocalcemia. Other QT-prolonging conditions include hypothermia, myocardial ischemia, increased intracranial pressure, and congenital long QT syndrome.
QT prolongation puts patients at risk of dysrhythmias such as torsades de pointes (TdP). TdP is a rare version of polymorphic ventricular tachycardia characterized by a pattern of alternating amplitudes, or “twisting points,” on ECG. It often occurs in hospitalized patients receiving QT prolonging interventions in the setting of underlying cardiac disease or electrolyte disturbances (1). A prolonged QTc interval increases the repolarization period of cardiac myocytes, and a premature ventricular contraction (PVC) that occurs during this repolarization period can cause TdP in the R on T phenomenon, which itself can degenerate into ventricular fibrillation (2).
The QT interval alone is not enough to determine the likelihood of developing dysrhythmias as the QT interval is inversely proportional to the heart rate, with the QT interval shortening at faster heart rates and lengthening at slower heart rates.
Several formulae have been developed to include both the QT interval and the heart rate to determine the risk of ventricular dysrhythmia. These calculated measurements are referred to as the corrected QT interval (QTc) and estimate the QT interval at a standard heart rate of 60 beats per minute. By correcting the QT interval for the heart rate, the physician is able to compare QT intervals at different heart rates over time and assess for increased risk of dysrhythmias.
The QTc is considered prolonged if greater than 440ms in males or 460ms in females. A QTc of greater than 500ms is associated with an increased risk of TdP (1).
Calculating the QT interval
The QT interval is measured from the beginning of the QRS complex to the end of the T wave. The QT interval should be measured in leads clearly demonstrating all portions to be measured, most frequently lead II or V5-6. The QT interval should be measured and averaged over 3 or more beats (3). U waves greater than 50% of the T wave amplitude and fused to the T wave should be included in the QT interval measurement. Smaller U waves and those separate from the T wave should be excluded from the measurement (4).
The end of the T wave is determined using the maximum slope intercept method, in which a tangent line is drawn through the maximum down slope of the T wave. The point at which this tangent line crosses the isoelectric line is the end of the T wave. The maximum slope intercept method can be particularly useful in patients with tachycardia when the subsequent P wave can obscure the terminal portion of the T wave.
Methods of calculating the QTc
Note that in the following formulae, RR is the interval between two consecutive R waves. In all the following formulae as written below the RR, QT, and QTc are expressed in seconds.
The most frequently used method for calculating the QTc is the Bazett formula, QTc = QT / √RR. Bazett published the first version of this formula in 1920 using ECGs from 39 young subjects and was subsequently updated by Taran and Szilagyi in 1947 (5,6). However, the Bazett formula under-corrects the QTc at slower heart rates while overcorrecting at faster heart rates (7,8,9). As patients are at increased risk of TdP at slower heart rate, the under-correction by the Bazett method at slower heart rates has prompted investigation into alternative formulae.
The Fridericia formula (QTc = QT / RR1/3) was also developed in 1920 (10). In a study of 108 patients, the Bazett formula was found to have a sensitivity for detecting manually measured QT prolongation of 54% compared to 100% sensitivity of the Fridericia formula (11). However, the Fridericia method is unreliable at higher heart rates.
To improve upon the inaccuracies associated with the non-linear Bazett and Fridericia formulae, in 1983 Hodges developed a linear QTc formula with a correction involving the heart rate (HR) (QTc = QT + 0.00175 * (HR - 60)) (12). The Framingham Heart Study published the Framingham linear regression analysis (QTc = QT + 0.154 * (1 - RR)) in 1992 (9). To develop this formula, the Framingham Heart Study included 5,018 subjects with a median age of 44 years.
In 1994, Karjalainen et al. compared the Bazett, Fridericia, and Framingham formulae in assessing 324 ECGs of young males with heart rates of 40-120 beats/min (13). The results showed that the Bazett formula performed poorly at all heart rates, the Fridericia formula failed at high heart rates, and the Framingham formula worked well at normal heart rates but failed at both low and high heart rates.
Luo et al. compared the Bazett, Fridericia, Framingham, and Hodges correction formulae using 10,303 ECGs with rates between 40 and 125 beats per minute in 2004 (14). The Hodges formula fit the database most appropriately overall, however all methods demonstrated rate-dependent bias. The Bazett formula had more correction at heart rates above 60 bpm, the Framingham formula provided less correction above 100 bpm, and the Fridericia and Hodges formulae had less correction below 60 bpm. Overall, the Bazett formula resulted in the least correction below 60 bpm and the most correction above 60 bpm, and Luo et al. cautioned against the widespread use of the Bazett formula, which remains the most commonly used method.
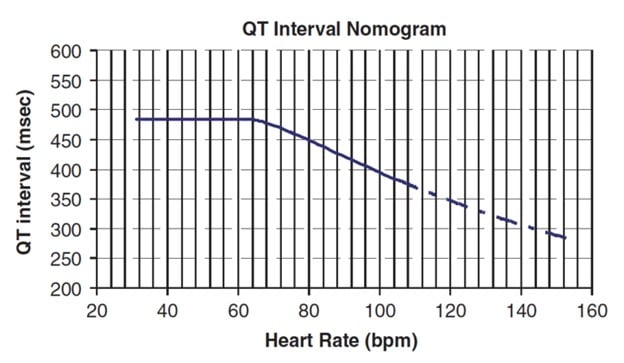
Karjalainen et al. had posited that a QT nomogram may work best for identification of prolonged QT (11). In 2007, Chan et al. developed a QT nomogram plotting QT interval duration versus heart rate as a possible better predictor for development of ventricular dysrhythmias in patients poisoned with QT-prolonging agents (15). The nomogram requires no calculations – the physician measures the QT interval and then plots the QT interval at the patient’s heart rate. If the QT interval is above the nomogram line, the patient is at risk of ventricular dysrhythmias. The initial study demonstrated superior accuracy of predicting the development of TdP compared to a Bazett QTc cutoff of both 440 and 500 ms (15). One drawback of the QT nomogram is its inability to determine the likelihood of developing TdP at varying thresholds above the nomogram line. The QT nomogram additionally cannot determine if a patient’s condition is improving or worsening over time.
The Rautaharju formula, QTc = QT * (120 + HR) / 180, is one of the newer methods for calculating the corrected QT interval. Developed in 2014 to minimize rate-dependent bias of QTc in the upper normal limits, the Rautaharju formula was derived from 57,595 cases of 46% males and 54% females ranging in age from 5 to 89 years (17). When a cutoff of 477 ms is used with the Rautaharju formula, the method has the same sensitivity, specificity, and accuracy as the QT nomogram and is superior to the Bazett and Fridericia formulae (18). Unlike the QT nomogram, the Rautaharju method allows for the assessment of the QTc in a continuous manner, providing a more reliable determination if a patient is improving or at increasing risk of TdP. Additionally, the Rautaharju formula has been demonstrated to have minimized the inaccurate corrections at extremes of heart rate present in other correction formulae (19).
Conclusion
Poisoning involving QT prolonging xenobiotics is common, as many medications can potentially prolong the QT interval. These patients are at risk of developing lethal arrhythmias such as TdP. The QT interval varies with heart rate, and several methods exist for attempting to account for heart rate when determining the “corrected” QT interval (QTc) and patients’ true risk of arrhythmia. Although the Bazett formula remains the most widely used method for determining QTc on automatic ECG machine interpretations, studies consistently show it to be unreliable at extremes of heart rate compared to other QTc formulae. Newer methods such as the QT nomogram and the Rautaharju formula are easy to use and may more accurately predict which patients are at risk for developing ventricular dysrhythmias. More prospective studies will be required to further determine the performance of these newer methods.
Table 1
|
QTc |
Formula |
|
Bazett |
QTc = QT / √RR |
|
Fridericia |
QTc = QT / RR1/3 |
|
Hodges |
QTc = QT + 0.00175 * (HR – 60) |
|
Framingham |
QTc = QT + 0.154 * (1 – RR) |
|
Rautaharju |
QTc = QT * (120 + HR) / 180 |
HR = Heart Rate. RR, QT, and QTc all in seconds.
Figure 1 (Chan et al.)
Acknowledgments
The authors would like to thank Dr. Robert Hoffman for inspiring them to learn about the Rautaharju formula and review the literature regarding the Bazett formula.
Works Cited
- Drew BJ, Ackerman MJ, Funk M, Gibler WB, Kligfield P, Menon V, Philippides GJ, Roden DM, Zareba W. Prevention of torsade de pointes in hospital settings: a scientific statement from the American Heart Association and the American College of Cardiology Foundation. Circulation. 2010 Mar;121(8):1047-1060.
- Burns, E., & Ella. (2020, November 03). Polymorphic VT and torsades de pointes (TdP) • LITFL. Retrieved December 05, 2020, from Learn More
- Postema PG and Wilde AAM. The measurement of the QT interval. Curr Cardiol Rev. 2014 Aug;10(3): 287-294.
- Waddell-Smith K, Gow RM, Skinner JR. How to measure a QT interval. Med J Aust. 2017 Aug;207(3):107-110.
- Bazett HC. An analysis of the time-relations of electrocardiograms. Heart. 1920;7:353-70
- Taran LM, Szilagyi N. The duration of the electrical systole, Q-T, in acute rheumatic carditis in children. Am Heart J. 1947 Jan;33(1):14-26. [PMID 20280672]
- Viskin S. The QT interval: too long, too short or just right. Heart Rhythm. 2009 May;6(5):711-5.
- Rautaharju PM, Zhang ZM. Linearly scaled, rate-invariant normal limits for QT interval: eight decades of incorrect application of power functions. J Cardiovasc Electrophysiol. 2002;13:1211–1218.
- Sagie A, Larson MG, Goldberg RJ, Bengtson JR, Levy D. An improved method for adjusting the QT interval for heart rate (the Framingham Heart Study). Am J Cardiol. 1992 Sep;70(7):797-801.
- Fridericia LS. Die Systolendauer im Elektrokardiogramm bei normalen Menschen und bei Herzkranken [The Duration of Systole in an Electrocardiogram in Normal Humans and in Patients with Heart Disease]. Part I: Beziehung zwischen der Pulsfrequenz und der Dauer des Ventrikelelektrokardiogramms bei normalen Menschen in der Ruhe [Relationship of the pulse frequency and the duration of the ventricular electrocardiogram in normal humans at rest]. Acta Med Scand. 1920;53:469–486 [Translated reprint: Ann Noninvasive Electrocardiol. 2003 Oct;8(4):343-51.]
- Charbit B, Samain E, Merckx P, Funck-Brentano C. QT interval measurement: evaluation of automatic QTc measurement and new simple method to calculate and interpret corrected QT interval.Anesthesiology. 2006 Feb;104(2):255-60.
- Hodges MS, Salerno D, Erlinen D. Bazett's QT correction reviewed: evidence that a linear QT correction for heart rate is better. J Am Coll Cardiol. 1983; 1:694.
- Karjalainen J, Viitasalo M, Mänttäri M, Manninen V. Relation between QT intervals and heart rates from 40 to 120 beats/min in rest electrocardiograms of men and a simple method to adjust QT interval rates. J Am Coll Cardiol. 1994;23:1547-53.
- Luo S, Mishler K, Johnston P, Macfarlane PW. A comparison of commonly used QT correction formulae: the effect of HR on the QTc of normal ECGs. J Electrocardiol. 2004;37(Suppl.):8190.
- Chan A, Isbister GK, Kirkpatrick CMJ, Duffel SB. Drug-induced QT prolongation and torsades de pointes: evaluation of a QT nomogram. QJM. 2007 Oct;100(10):609-15.
- Waring WS, Graham A, Gray J, Wilson AD, Howell C, Bateman DN. Evaluation of a QT nomogram for risk assessment after antidepressant overdose. Br J Clin Pharmacol. 2010;70:881-5.
- Rautaharju PM, Mason JW, Akiyama T. New age- and sex-specific criteria for QT prolongation based on rate correction formulas that minimize bias at the upper normal limits. Int J Cardiol. 2014;174:535-40.
- Othong R, Wattanasansomboon S, Kruutsaha T, Chesson D, Vallibhakara SA, Kazzi Z. Utility of QT interval corrected by Rautaharju method to predict drug-induced torsade de pointes. Clin Tox. 2019;57:234-9.
- Rabkin SW, Cheng XB. Nomenclature, categorization and usage of formulae to adjust QT interval for heart rate. World J Cardiol. 2015;7:315-25.
Nicholas Titelbaum, MD
Michael Simpson, MD
Shelby Randall, DO
Katelynn Baska
Alexa Peterson
Emergency Medicine Residents’ Association, Toxicology Committee Leadership Team