Venous Doppler and IV Fluid Administration
ACEP Ultrasound Fellow Subcommittee
Introduction: Fluid Stewardship
As emergency physicians, we have all seen this time and time again: a febrile and tachycardic patient arrives to the ED, gets flagged as “sepsis,” and a bolus of 30 mL/kg of normal saline is ordered in addition to a legion of antibiotics.1 In some cases, these orders are placed without regard for any past history or underlying conditions to comply with metrics. While we give this fluid to “fill the tank” to allow for better perfusion, there may be overly rapid engorgement of the venous system causing a paradoxical decrease in organ perfusion. Large volume fluid resuscitation has been associated with worsened outcomes for some patients in recent literature.2,3 While attempting to maximize hemodynamics, the question becomes whether we end up doing more harm than good for some patients with large volume resuscitation.
The goal of fluid resuscitation in sepsis has always been simple: increase venous return by increasing venous supply, thereby allowing for an increase in stroke volume and cardiac output. However, studies have shown that less than 50% of hemodynamically unstable patients with sepsis respond to fluids with an increase in stroke volume.4 Likewise, when large amounts of crystalloids are infused, it can lead to severe tissue edema and signs of volume overload that further prevents oxygen delivery and distorts surrounding tissues. In areas where organs are contained within a defined space like the abdomen, edema can cause engorgement of organs like the liver and kidneys which may lead to many deleterious downstream effects such as increased intra-abdominal pressures and compartment syndrome, leading to worsening clinical status for these patients.2,3
Recent evidence suggests that early vasopressors with a restrictive fluid strategy confer a mortality benefit.5 We therefore propose a shift in paradigm for fluid management to mitigate these potential harms. Rather than treating with fluids to a theoretical ceiling until we see a benefit, we would suggest treating to a theoretical floor to avoid harm. Venous doppler provides us a potentially safe and noninvasive way to answer the question of when to stop intravenous fluids, and when to start active fluid removal.
Riding the Waves: How to get venous doppler images
Several venous doppler waveforms can provide information on whether a patient has reached a level where further fluid administration may cause more harm. These venous waveforms include that of the hepatic vein, portal vein, and renal vein. It is important to note that these waveforms remain prominent primarily in the setting of a dilated IVC, so evaluating the IVC is the critical first step for these patients. This is something that is broadly taught, but a view of the intrahepatic IVC in short and long axis can help identify if there is any evidence of venous congestion. It is important to not only identify if there is any respiratory variation (indicated by increasing variation during respiration) but also for the overall size of the IVC. In many cases, the IVC will remain a more sensitive measurement for venous congestion but cannot provide as detailed information. As such, it is recommended that this be the start of your venous doppler studies.
The hepatic vein and portal vein doppler measurements are typically obtained through the liver. The hepatic vein doppler can be obtained from any of the three large hepatic veins that lead into the IVC, whilst the portal vein divides into left and right, either of which can be applicable for this study (Figure 1). The two veins can be differentiated from each other, as the hepatic veins can be traced to the IVC, and the portal vein can be traced to the portal triad. The patient should be supine and the IVC should be first identified. The middle hepatic vein is best approached from a subxiphoid approach while the right hepatic vein is best viewed from a lateral approach. Likewise, the right portal vein is best identified on a lateral view of the liver.
Figure 1. Portal vein and hepatic vein visualization in B-mode6
(Reproduced with permission)
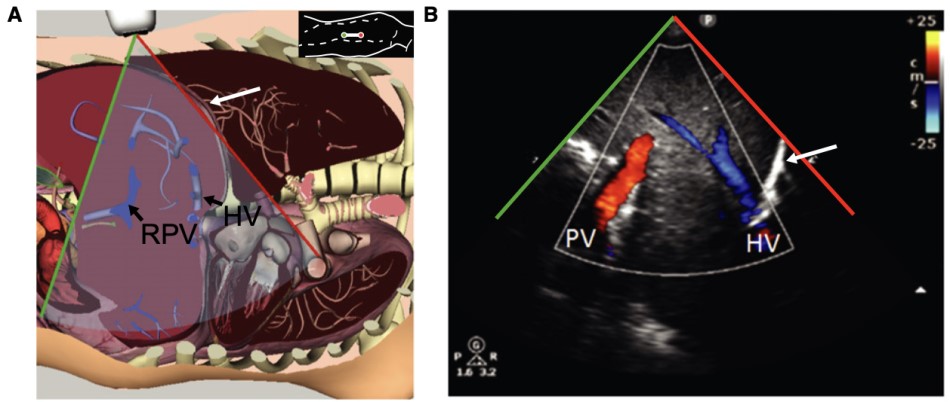
A: Probe placed along right mid to posterior axillary line
B: Color Doppler demonstrates both portal vein (PV) and hepatic vein (HV)
Once a view is obtained, a pulsed wave doppler should be placed within the hepatic vein, attempting to position at an angle parallel to the flow of the vessel for optimal waveform (Figure 2).
Figure 2. Normal hepatic vein Doppler (S>D wave)7
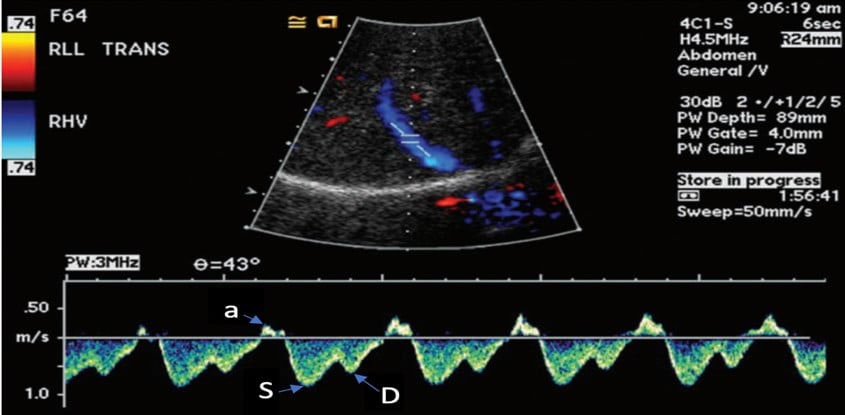
a= atrial kick
S= atrial systolic filling
D= atrial diastolic filling
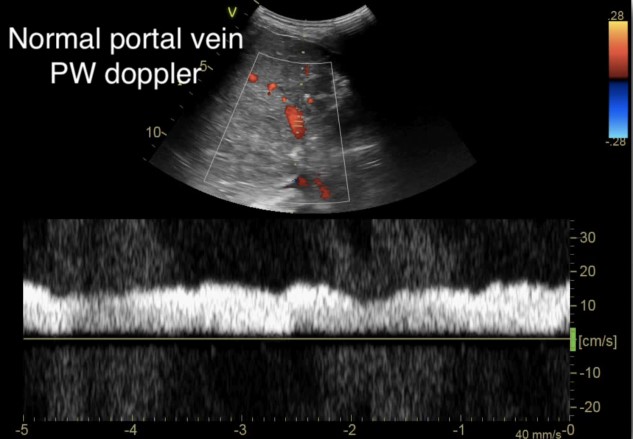
This is then repeated for the portal vein, allowing for adjustment of the image to obtain an optimal view (Figure 3). To help optimize measurements, the patient should perform a respiratory hold, as movement of the vessel itself during respirations limits the ability to obtain an accurate waveform.
Figure 3. Normal portal vein Doppler (continuous flow)10
(Reproduced with permission from Rola, Spiegel, and Haycock)
Intra-renal doppler exams, on the other hand, require a lateral view of each kidney to obtain a classic renal view (Figures 4 and 5). Use color Doppler to identify the interlobar vessels that lie beside the medullary pyramids. If not readily appreciable on initial views, fan the probe or alter alignment until an appropriate color flow can be identified. After the vessels are identified, switch to pulsed wave Doppler and place the gate over the interlobar vessels, allowing for identification of the arterial and venous waveforms. From these images you should be able to evaluate the renal artery resistive index (RRI) and renal vein pulsatility waveform.
Figure 4. Renal Arterial Resistive Index (RI) 10
(Reproduced with permission from Rola, Spiegel, and Haycock)
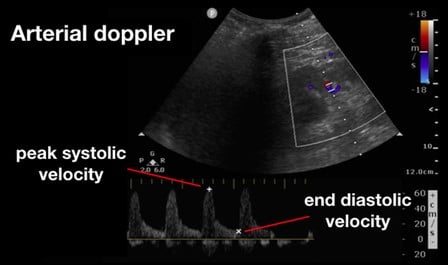
Figure 5. Renal Vein Doppler with normal flow6
(Reproduced with permission)
Venous flow is seen underneath the baseline and is continuous (normal)
Understanding the Waves: The Physiology of Venous Doppler
For decades, point of care ultrasound (POCUS) has focused on the IVC as the first screening tool for fluid tolerance. As the venous system becomes overloaded, whether due to noncompliance, obstructive shock, or cardiogenic failure, the harbinger is dilation of the IVC. When the IVC becomes plethoric, it reaches the limit of its compliance and as a result the remainder of the venous system within the liver becomes enlarged. This alters the flow of the hepatic vein, the portal vein, and the renal vein. Each vein captures a slightly different aspect of the body’s ability to regulate venous flow. It is by looking at these veins that we can best determine to what degree the venous system is being overloaded or over-resuscitated.
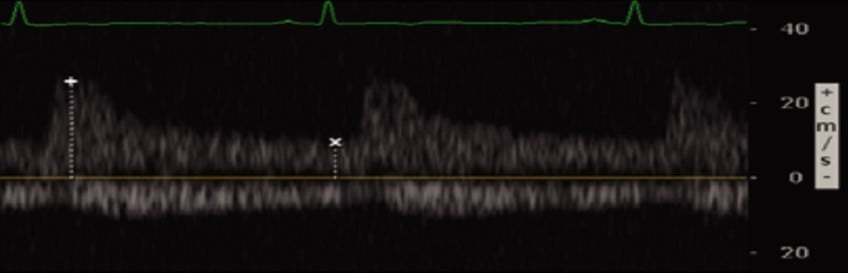
The venous flow within the hepatic veins can be best thought of as a central venous pressure (CVP) tracing from the right atrium, reflecting the cardiac cycle of the right heart. Understanding this, the hepatic venous doppler waveform helps not only in the evaluation of venous congestion but also right heart function. The typical CVP tracing reveals an atrial kick, followed by systolic and diastolic filling of the atrium. A normal hepatic venous doppler will reveal a retrograde “a” wave followed by two antegrade “S” and “D” waves, as seen in Figure 2. A normal waveform consists of a relatively small a wave with the S wave larger than the following D wave (S>D), as a there is greater primary venous flow into the atrium during systole. As the venous system becomes engorged, the S wave becomes smaller relative to the D wave (S<D), due to a physiologic change from primarily systolic filling to a relative increase in passive diastolic filling of the heart (Figure 6A). As congestion continues, there is S wave reversal as seen in Figure 6B. The relative doppler flows noted in these tracings can thus help determine whether the heart is providing sufficient forward flow to prevent further venous engorgement, as well as help in the identification of right heart lesions, such as tricuspid regurgitant flows. Regurgitant flows may affect the pressures that are placed on the venous system. As such, hepatic vein flows can provide critical information about how the heart functions in response to increased venous congestion and determine when we have strained the heart to a point where it may benefit from de-resuscitation.
Figure 6. Abnormal hepatic vein Doppler6
(Reproduced with permission)
A: Hepatic flow with S<D wave
B: S wave with reversal
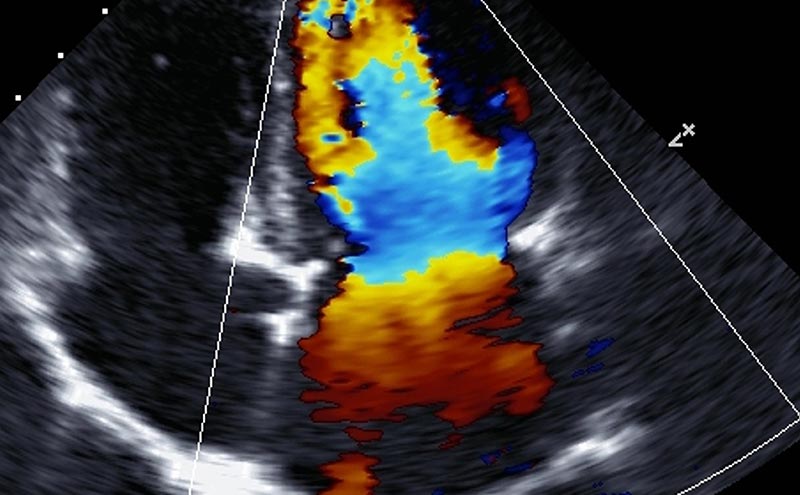
As we go past the hepatic sinusoids, into the portal venous system, the venous flow loses much of its pulsatility and instead maintains a more constant blood flow at normal levels of venous return. The normal portal venous waveform is continuous, as seen in Figure 3, and represents the flow of blood as it is buffered from the hepatic sinusoids. This unique aspect of the portal venous flow makes it more specific for increased venous congestion than measurement of the other veins, as it takes a greater amount of venous congestion to cause pulsatility in the portal vein. As venous congestion worsens, the portal vein will exhibit an increasing variation in the flow as the right atrial pressures increases and the hepatic sinusoids, which help regulate that flow, fail to compensate. This abnormal portal venous pulsatility is seen in Figure 7. As such, the portal vein waveform provides vital information about the ability of the liver itself to regulate venous flow and pulsatility.
Figure 7. Abnormal portal vein Doppler (pulsatile)
(Author's Own Image)
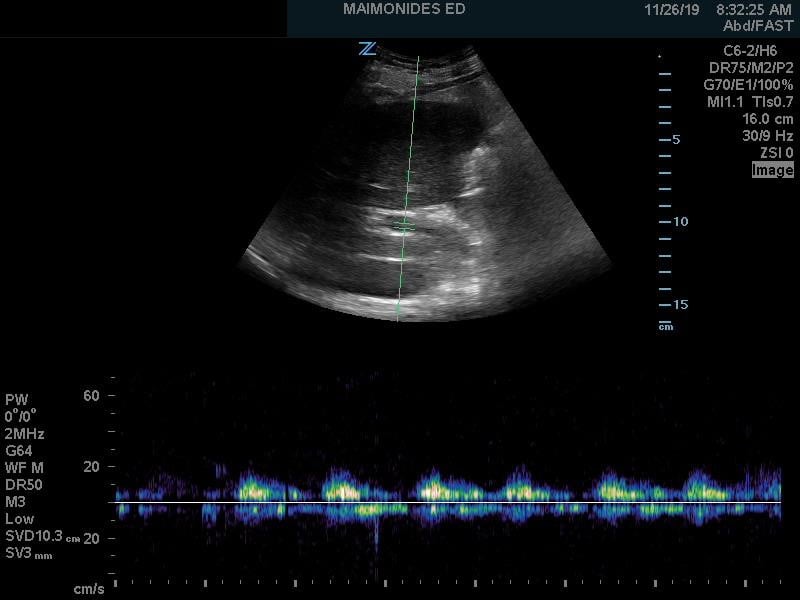
Abnormal portal venous pulsatility
Beyond the liver, the renal artery and vein play an important role in the assessment for venous congestion and fluid overload. To accomplish this, doppler evaluation typically aims to determine blood flow within the interlobular or arcuate vessels within the renal parenchyma. As both the artery and vein run together, the renal arterial and venous waveforms are usually obtained simultaneously. For the artery, a pulsatile waveform is located as seen in Figure 4. The renal resistive index (RRI) can then be calculated by taking the systolic peak velocity minus the end-diastolic velocity over the peak systolic velocity (RRI = [Vs-Vd]/Vs). When this value is greater than 0.7, it is considered to be pathologic, and is concerning for decreased renal perfusion via a decrease in diastolic arterial blood flow. As this value approaches 1, the diastolic arterial blood flow is absent. This finding, however, is nonspecific for venous congestion itself, although impairments in arterial flow can provide a window into venous congestion, especially within cardiac patients.
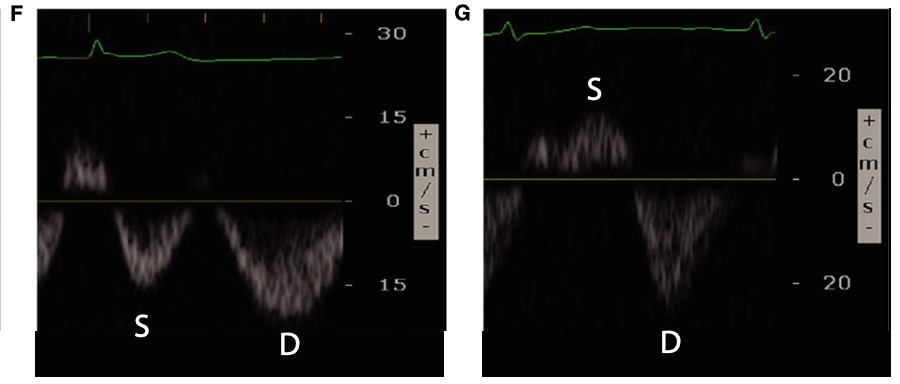
Conversely, renal venous flow remains a more specific marker for renal vein congestion and renosarca as it allows us to assess venous congestion within the venous system itself. As right atrial pressures increase, similar in nature to the hepatic vein, the normal continuous intra-renal venous doppler pattern (Figure 5) transitions to an interrupted biphasic pattern (Figure 8A), and ultimately to a primarily diastolic venous flow pattern (Figure 8B). This remains physiologically similar to our understanding of the hepatic venous waveforms: as right atrial pressures rise; the systolic venous flow will gradually decrease until a primary diastolic venous flow is present. At this point, the venous system loses its ability to compensate for increased fluid. When compared to hepatic venous flow, renal flow provides two major advantages: an ability to easily determine systolic and diastolic flow and being more specific to renal venous congestion.
Figure 8. Abnormal renal vein Doppler6
(Reproduced with permission)
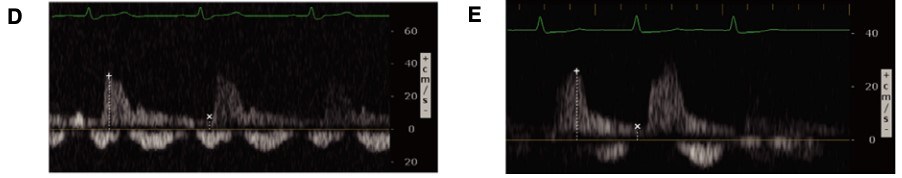
A: Biphasic systolic and diastolic venous flow
B: Monophasic diastolic venous flow
Philippe Rola and his team have protocolized these venous Doppler interpretations into a scoring system, the Venous Excess Ultrasound Score (VEXUS score).8 The VEXUS score helps to clarify the degree of venous congestion, providing a scale for better quantification of venous congestion on ultrasound. The score itself ranges from 0 to 3, as seen in Table 1, with 0 indicating no evidence of venous congestion and 3 indicating severe venous congestion. To determine the score, the waveforms for the IVC, hepatic vein, portal vein, and renal vein are graded based on parameters outlined in Table 2. A score of 0 indicates evidence of fluid tolerance (an IVC with respiratory variation), with a score of 1 indicating mild congestion (flat IVC with normal HV/PV/RVD), a score of 2 indicating moderate congestion (flat IVC with grade 1 HV/PV/RVD), and a score of 3 indicating severe congestion (flat IVC and grade 2 HV/PV/RVD). This schema allows us to better evaluate for venous congestion in the acute setting but remains to be proven as a clinically useful tool for management.
Table 1. VEXUS Score
|
Score |
Findings |
|
0 |
IVC Grade <3, HD grade 0, PV grade 0, RD grade 0 |
|
1 |
IVC Grade 4 + Normal (Grade 0) HV/PV/RVD patterns |
|
2 |
IVC Grade 4 + Mild (Grade 1) flow pattern abnormalities in HV/PV/RVD |
|
3 |
IVC Grade 4 + Severe (Grade 2) flow pattern abnormalities in HV/PV/RVD |
VEXUS = Venous Excess Ultrasound Score
IVC = inferior vena cava
HD = hepatic vein Doppler
PVD = portal vein Doppler
RVD = renal vein Doppler
Table 2. Grading the Components of VEXUS Score
|
IVC grade |
Findings |
|
Grade 0 |
< 5 mm with respiratory variation |
|
Grade 1 |
5-9 mm with respiratory variation |
|
Grade 2 |
10-19 mm with respiratory variation |
|
Grade 3 |
> 20 mm with respiratory variation |
|
Grade 4 |
> 20 mm without respiratory variation |
|
HD grade |
Findings |
|
Grade 0 |
Normal S > D wave |
|
Grade 1 |
S < D wave with antegrade S |
|
Grade 2 |
S wave flattened or biphasic |
|
PVD grade |
Pulsatility Index = (Vmax-Vmin)/Vmax |
|
Grade 0 |
< 0.3 pulsatility index |
|
Grade 1 |
0.3-0.49 pulsatility index |
|
Grade 2 |
0.5-1.0 pulsatility index |
|
RVD grade |
Findings |
|
Grade 0 |
Continuous monophasic flow |
|
Grade 1 |
Discontinuous biphasic flow |
|
Grade 2 |
Diastolic monophasic flow (discontinuous) |
VEXUS = Venous Excess Ultrasound Score
IVC = inferior vena cava
HD = hepatic vein Doppler
PVD = portal vein Doppler
RVD = renal vein Doppler
What does it mean?
Ultimately, venous doppler waveforms help to provide information on the degree to which there is venous congestion and, indirectly, into the function of the right heart. Initial studies found that there was a relationship between renal Doppler waveforms and right atrial pressures which signified a possible cause of cardiorenal syndrome, but were unable to show any patient centered benefits.9-11 Theoretically, as venous congestion worsens, we should see worsening of end-organ function, especially within relatively closed systems such as the abdomen.
Beaubien-Souligny, et al. looked at POCUS venous dopplers in patients after post-cardiac surgery, using venous doppler to evaluate for evidence of fluid overload. They found that increased portal venous pulsatility (measured as an index) and infra-renal venous flow variations were both independently associated with acute kidney injury (AKI) in post-cardiac surgery patients. This suggests a relationship between worsening venous congestion and worsening renal dysfunction. Indeed, even with CVP monitoring in patients, venous doppler remained a reliable independent predictor for worsening AKI in this study. The VEXUS score outperformed CVP in predicting AKI and need for vasopressor support.6,12 While there has been insufficient evidence on the impact of venous doppler studies on other patient-oriented outcomes, these initial studies appear promising.
Conclusions
The role of venous doppler in the fluid management of critically ill patients is a relatively new field for study, with numerous clinical questions remaining to be both asked and answered. While we are still in the process of learning what clinical significance these measurements have, understanding normal versus abnormal venous doppler waveforms may help us identify patients at high risk for the harmful effects of over-resuscitation.
References
- Dellinger RP, Levy MM, Rhodes A, et al. Surviving sepsis campaign: international guidelines for management of severe sepsis and septic shock: 2012. Crit Care Med. 2013;41(2):580−637. DOI: 10.1097/CCM.0b013e31827e83af.
- Malbrain ML, Marik PE, Witters I, et al. Fluid overload, de-resuscitation, and outcomes in critically ill or injured patients: a systematic review with suggestions for clinical practice. Anesthesiology Intensive Therapy. 2014;46(5):361-380DOI: 10.5603/AIT.2014.0060.
- Malbrain ML, Van Regenmortel N, Saugel B, et al. Principles of fluid management and stewardship in septic shock: it is time to consider the four D’s and the four phases of fluid therapy. Ann Intensive Care. 2018;8(1):66. DOI:10.1186/s13613-018-0402-x.
- Marik PE, Monnet X, Teboul JL: Haemodynamic parameters to guide fluid therapy. Ann Intensive Care. 2011;1(1):1. DOI: 10.1186/2110-5820-1-1.
- Permpikul C, Tongyoo S, Viarasilpa T, et al. Early use of norepinephrine in septic shock resuscitation (CENSER): A randomized trial. AM J Respir Crit Care Med. 2019;199(9): 1097-1105.DOI: 10.1164/rccm.201806-1034OC.
Mark Grbic, MD
Ultrasound fellow Maimonides Medical Center and Attending Physician
Maimonides Medical Center, Brooklyn, NY
Errel Khordipour, MD
Director of US Research and EM attending at Maimonides Medical Center in Brooklyn, NY
Judy Lin, MD, FACEP
US Fellowship Director and EM attending at Maimonides Medical Center in Brooklyn, NY
@judylin422