March 8, 2021
Lung
Stephen Alerhand MD, Betul Gulalp MD
I. Introduction and Indications
- Unlike other physical structures in the body, normal healthy lung is not actually visualized on the ultrasound (US) window due to the scattering of sound waves by air molecules at the pleural interface. Instead, the sonographic window depicts artifacts based on the tenets of US physics. These artifacts must be understood in order for lung ultrasonography (LUS) to be interpreted accurately.
- This concept was not fully recognized until the 1990’s, when the pioneering work of Daniel Lichtenstein and others allowed physicians to confidently incorporate LUS into the clinical setting.
- LUS can be used to answer focused clinical questions (ie, etiology of acute dyspnea) in the emergency department (ED) and evaluate for: pneumothorax (PTX), interstitial edema, pleural effusion, pneumonia, pulmonary embolism (PE), pulmonary contusion, atelectasis, and acute respiratory distress syndrome (ARDS).
- LUS is available at the bedside, rapidly performed, can be performed serially, and avoids ionizing radiation.
- It can assess dynamic changes over time and often detects these changes earlier than chest x-ray (CXR).1
- US findings of lung disease appear similarly in pediatric patients.2-6
Diagnostic Accuracy of Ultrasound
- The BLUE Protocol delineates an approach for the evaluation and diagnosis of acute dyspnea.7
- Provided correct diagnosis in 90.5% of dyspneic patients admitted to the intensive care unit (ICU) with a definite diagnosis (n=260).
- An integrated POCUS approach evaluating the lung, heart, and inferior vena cava (IVC) in patients with dyspnea and respiratory complaints may provide earlier diagnosis.8, 9
Pneumothorax
- Superior to supine anterior CXR for ruling in and ruling out PTX 10-17
- Sensitivity 92-100%, specificity 91-99%, positive predictive value 89-92%, negative predictive value 93-100%
- Consistent with computed tomography (CT) in determining size of the PTX 13-15
Alveolar-Interstitial Syndrome
- Superior to CXR for ruling in and ruling out significant interstitial lung disease10,18, 19
- Sensitivity 86-93%, specificity 93-98%
- B-lines more sensitive than auscultation in end-stage renal patients before and after hemodialysis.20
Pleural Effusion
- More accurate for diagnosing pleural effusion than supine CXR 21-23 and nearly as accurate as CT.24
- Sensitivity 88-94%, specificity 96-100%, positive predictive value 92-100, accuracy 90-93% 21,23-27
- Volume can be measured more accurately than with CXR.28
- Can detect as little of 20 mL of fluid,29 whereas upright CXR detects 100-200 mL of fluid30
Consolidation
- Good accuracy for diagnosing consolidation compared with CXR2,31-36
- Sensitivity 90-98%, specificity 94-98%
- Children: Sensitivity 87-89%, specificity 95-100%, positive predictive value 92.5%, negative predictive value 90.8%
- Small consolidations ≤ 1 cm are less likely to be visualized in the sagittal plane37 and on CXR.38
Pulmonary Embolism
- Multi-organ US (lung, heart, vein) is more sensitive (90%) than single organ assessment (subpleural infarct 60.9%, right ventricular dilatation 32.7%, deep vein thrombosis 52.7%) for increasing the accuracy of clinical pre-test probability estimation in patients with suspected PE.39
- LUS and DVT assessment may enhance the pretest risk stratification of the Wells score (sensitivity 69.6% versus 57.6%, specificity 88.2% versus 68.2%) in the early diagnostic evaluation for PE.40
Pulmonary Contusion
- Alveolar-interstitial syndrome: sensitivity 94.6%, specificity 96.1%, positive predictive value 94.6%, negative predictive value 96.1%, accuracy 95.4% in the ED.41
- Subpleural consolidations: sensitivity 18.9%, specificity 100%, positive predictive value 100%, negative predictive value 63.0%, accuracy 65.9% in the ED.41
- More sensitive than CXR, which had sensitivity 27% and specificity 100% in the ED.41
- CXR findings may take several hours to appear and be missed on initial assessment.42
- Consolidation is maximal at 24-48 hours43, and all vanish in a few days.44
- CXR findings may take several hours to appear and be missed on initial assessment.42
Atelectasis
- Sensitivity 82-90%, specificity 89-100%, positive predictive value 84-100%, negative predictive value 86-94%, accuracy 89-91%45-47
- Children: Sensitivity 88%, specificity 89%, 88% accuracy48
Acute Respiratory Distress Syndrome (ARDS)
- More accurate than auscultation and CXR for detecting and distinguishing pleural effusion, alveolar consolidation, and alveolar-interstitial syndrome, and also for assessing extent of lung injury, in mechanically ventilated patients with ARDS.27
- Accuracy: 97% for consolidation, 93% for pleural effusion, and 95% for interstitial syndrome
- These non-homogenous lung pattern findings are corroborated by those found on CT imaging.49
- Can aid in differentiating ARDS from cardiogenic pulmonary edema.50-52
- Figure 1. Lung anatomy53
- The trachea branches into the two primary bronchi at the hilum, which then divide into bronchioles. These subsequently branch off into the alveolar ducts and then the alveoli themselves.
- Each lung is enclosed within visceral pleura, dividing the right lung into three lobes and the left lung into two. These structures all lie within the parietal pleura adherent to the inner wall of the rib cage. The pleural cavity in between these two layers contains a lubricating pleural fluid.
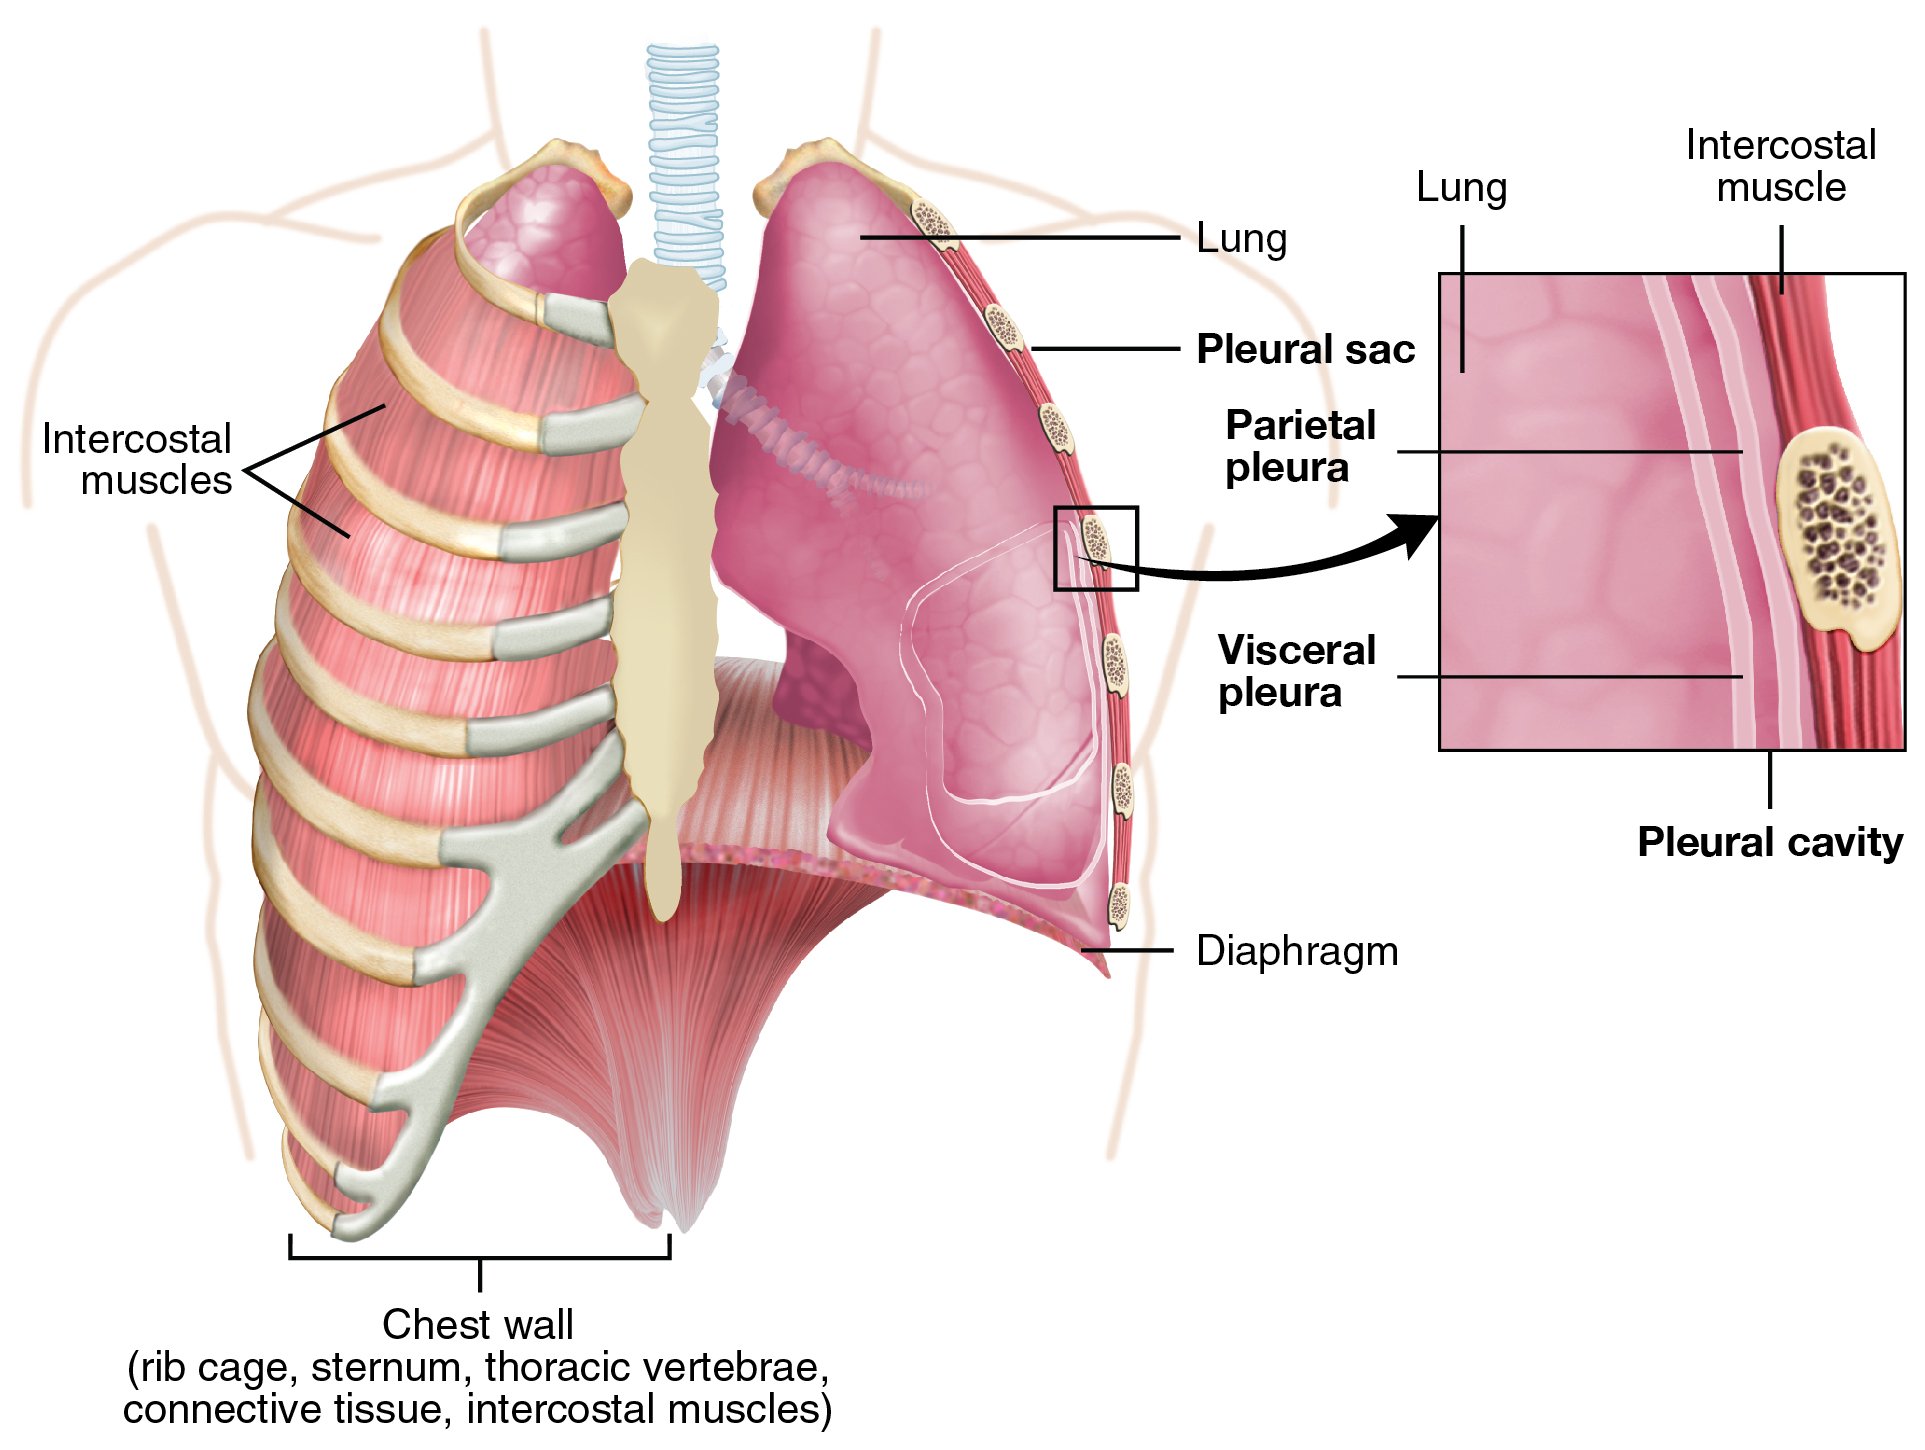
- Figure 2. Anatomy of pleural interface. (Source: https://commons.wikimedia.org/wiki/File:2313_The_Lung_Pleurea.jpg)
- Each bronchopulmonary segment carries its own blood supply.
- The pulmonary interstitium refers to the collection of support tissues extending throughout both lungs. It consists of the alveolar epithelium, pulmonary capillary epithelium, basement membrane, perivascular, and perilymphatic tissues.
II. Common LUS Principles and Artifacts
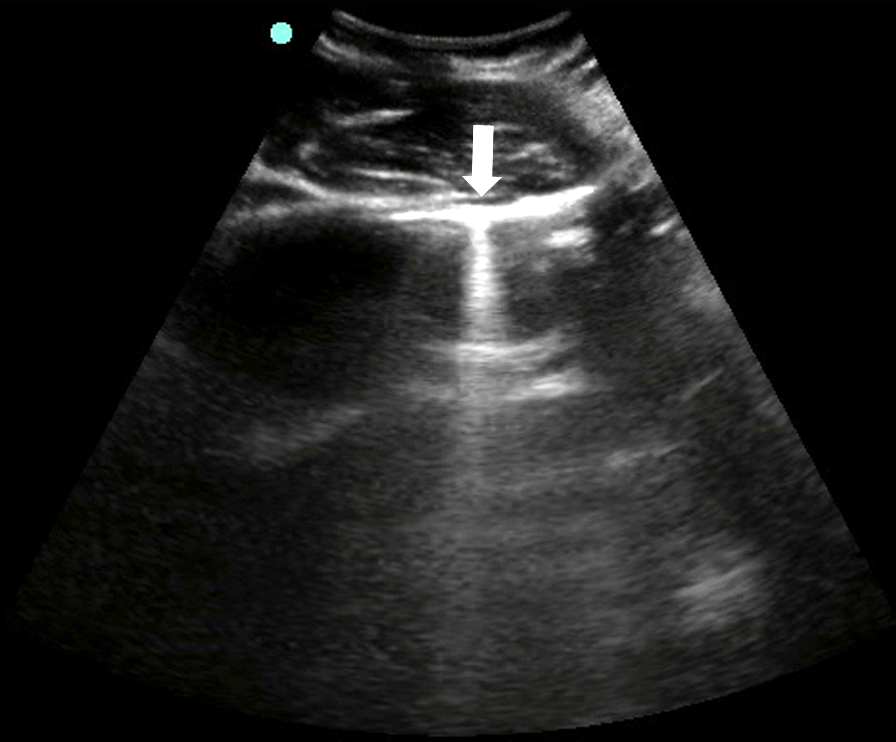
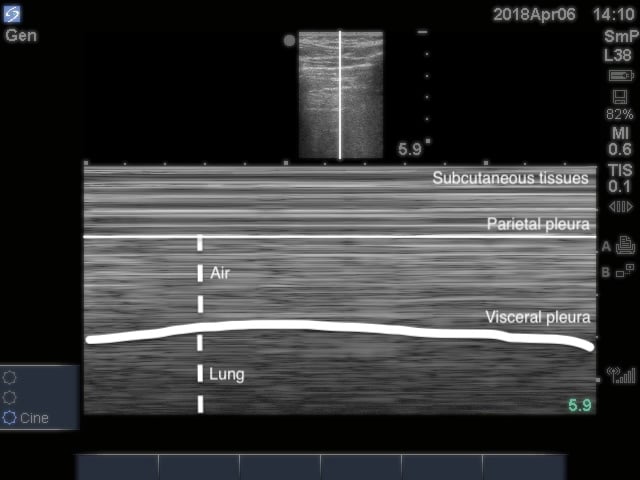
Visceral-Parietal Pleura Interface (VPPI)
- Bat sign
- The two ribs on either side of the intercostal space appear as hyperechoic lines with a posterior acoustic shadow, as most of the US waves are reflected due to bone’s high acoustic impedance.
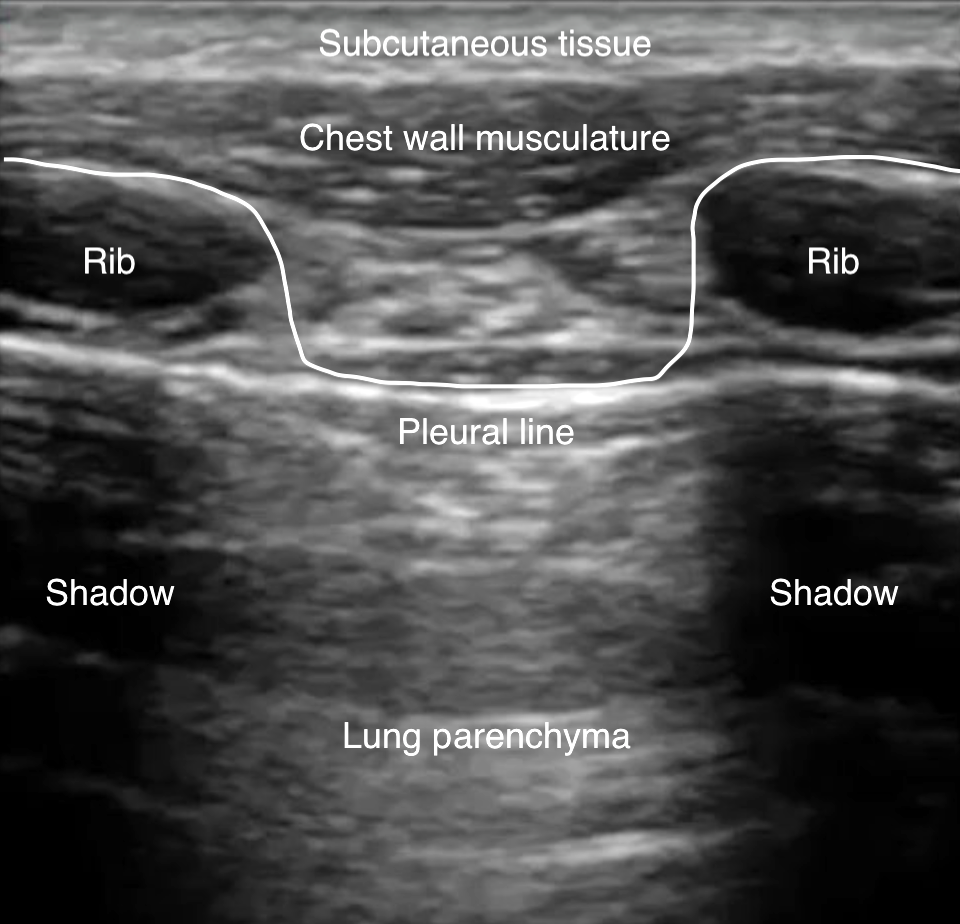
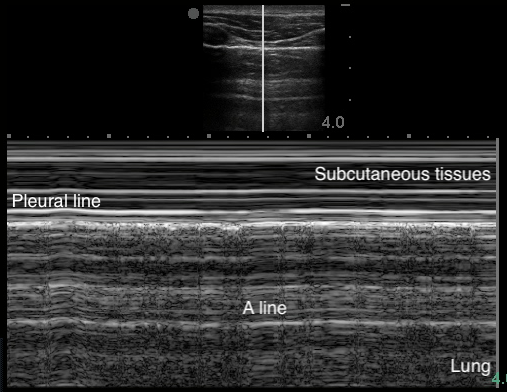
- Figure 3. Bat sign
- The closely apposed visceral and parietal pleura cannot be differentiated and appear as one hyperechoic horizontal line deep to the intercostal muscles.
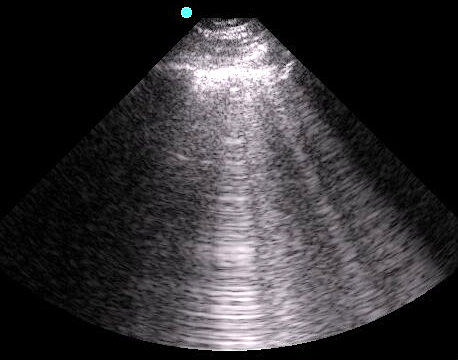
A-Lines
- Indicate normal aerated lung
- Horizontal reverberation artifact lines originating from the visceral pleura
- Figure 4. A-lines
Video 1. A-lines - Occur from the emitted US wave reflecting back and forth between the transducer and the pleural line
- The distance from transducer to pleural line is the same as between the equidistant intervals separating each subsequent A-line.
- The artifacts’ brightness decreases with depth as energy is lost through repeated reflections.
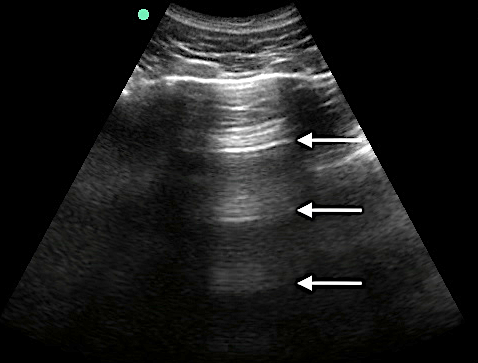
B-Lines
- Indicate increased density or fluid
- Vertical hyperechoic comet-tail reverberation artifacts that arise from the pleural line, erase A-lines, move with respiration, and extend to the bottom of the sonographic window without fading.
- Figure 5. B-lines
- Video 2. B-lines
- Occur due to multiple reflections of sound waves trapped between air and water-rich structures of pulmonary interstitium
- 1-2 B-lines may be detected in dependent regions of normal aerated lung.19
- < 3 B-lines within an intercostal space is considered normal.18, 19
- With increasing density or fluid, more B-lines will appear and coalesce into “lung rockets.”)
- Figure 6. Lung rocket
- Diffuse, bilateral, symmetric: pulmonary edema54
- Focal: PNA, atelectasis, pulmonary contusion, pulmonary infarction, pleural disease, neoplasia10, 55
- Absent: consider bronchial disorders like chronic obstructive pulmonary disease (COPD) and asthma7, 56, 57
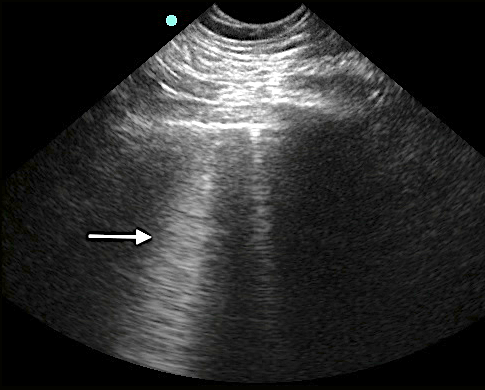
Z-Lines
- No pathologic meaning
- Often extend from pleural line, but fade before reaching the bottom of the sonographic window58
- Figure 7. Z-line
- Do not clearly move with lung sliding, are usually less hypoechoic than the pleural line, and do not erase A-lines59,60
- The closely apposed parietal and visceral pleura “trap” the emitted sound waves, which then travel repeatedly back and forth between the two surfaces.
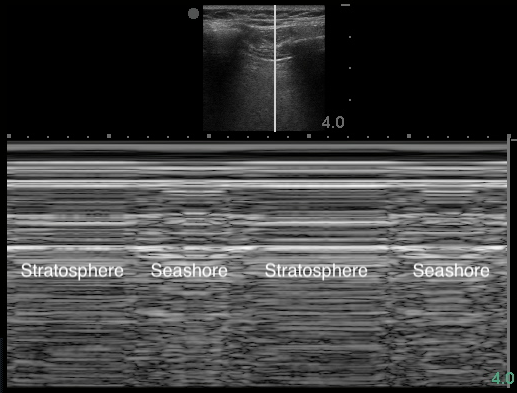
Lung Sliding
- Horizontal to-and-fro sliding movements of the visceral pleura in synchrony with respiration along the directly apposed parietal pleura, as seen in B-mode
- Video 3. Lung sliding
- B-lines arise from visceral pleura. Thus, their presence indicates that the visceral pleura is directly opposing the parietal pleura.
- More pronounced inferiorly than superiorly, as the base has more vertical movement with respiration than the apex
- Can also be visualized in M-mode (Image 8) and using power Doppler61 (Video 4)
- Figure 8. Seashore sign
- Video 4. Evaluating for lung sliding using power Doppler
- Lung sliding rules out PTX16
- Pitfalls:
- Subcutaneous emphysema
- False lung sliding from the movement of echogenic muscle layers resembling the pleural line
- E-lines: false B-lines arising from subcutaneous air that have no respiratory variation and still erase-A lines.1,11
- Subcutaneous emphysema
- Video 5. Subcutaneous emphysema
Lung Pulse
- Subtle rhythmic movement of the visceral pleura along the parietal pleura with each cardiac contraction58
Video 6. Lung pulse 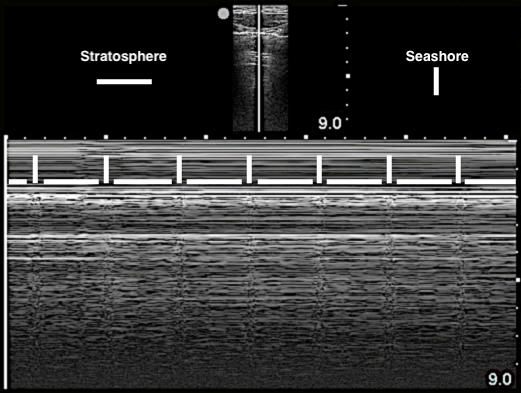
- Figure 9. Lung pulse in M-mode
- Reflects transmission of heart vibrations through a motionless lung
- Only occurs if parietal and visceral pleura are apposed
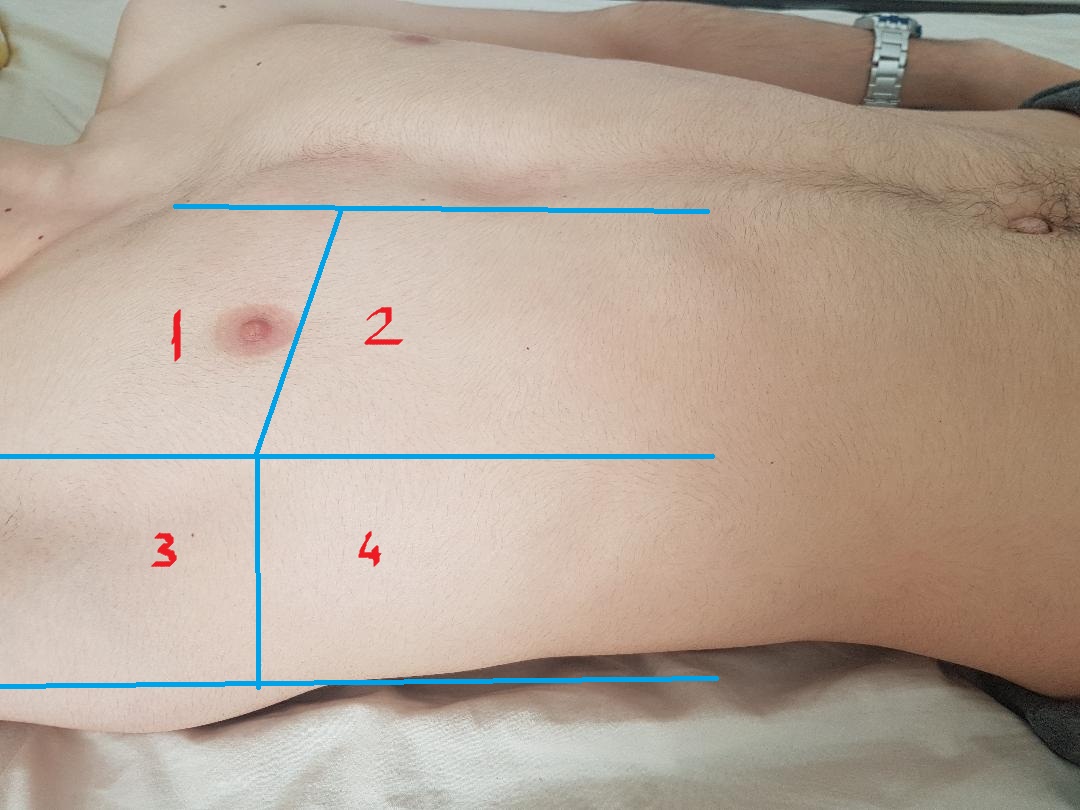
- Surface Anatomy to Guide Best Scanning Approaches
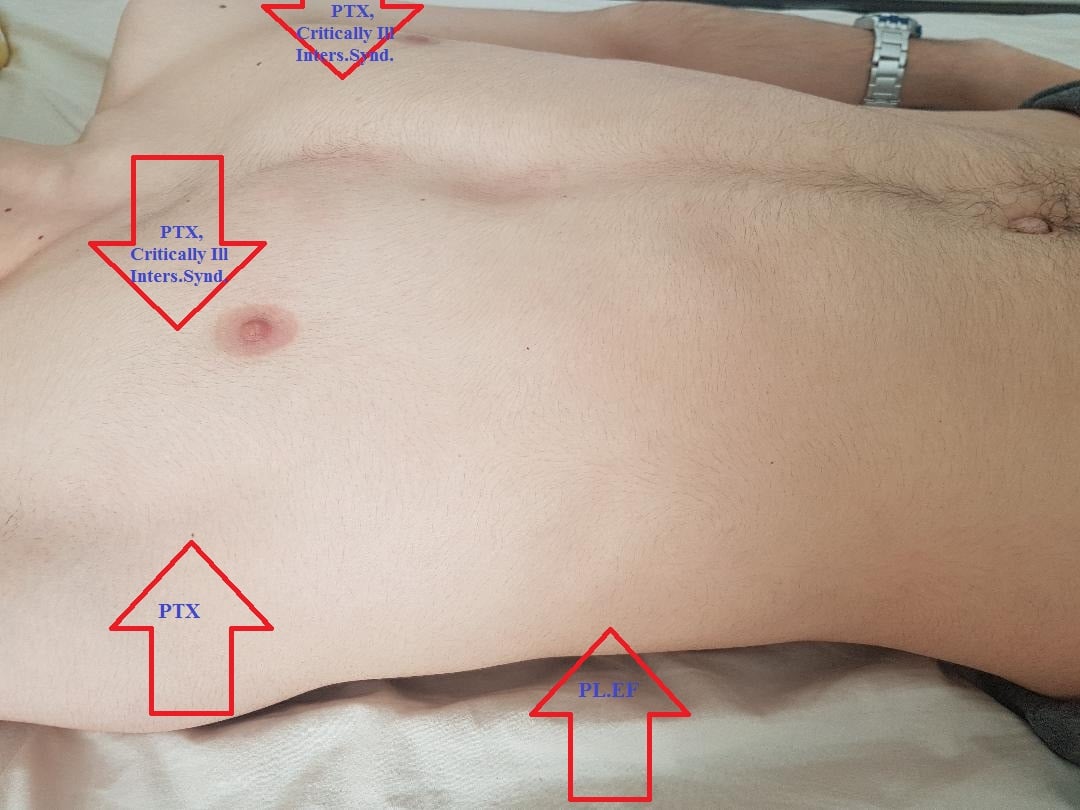
- Figure 10. Surface anatomy to guide best scanning approach
- Scanning Technique and Normal (Negative) Findings
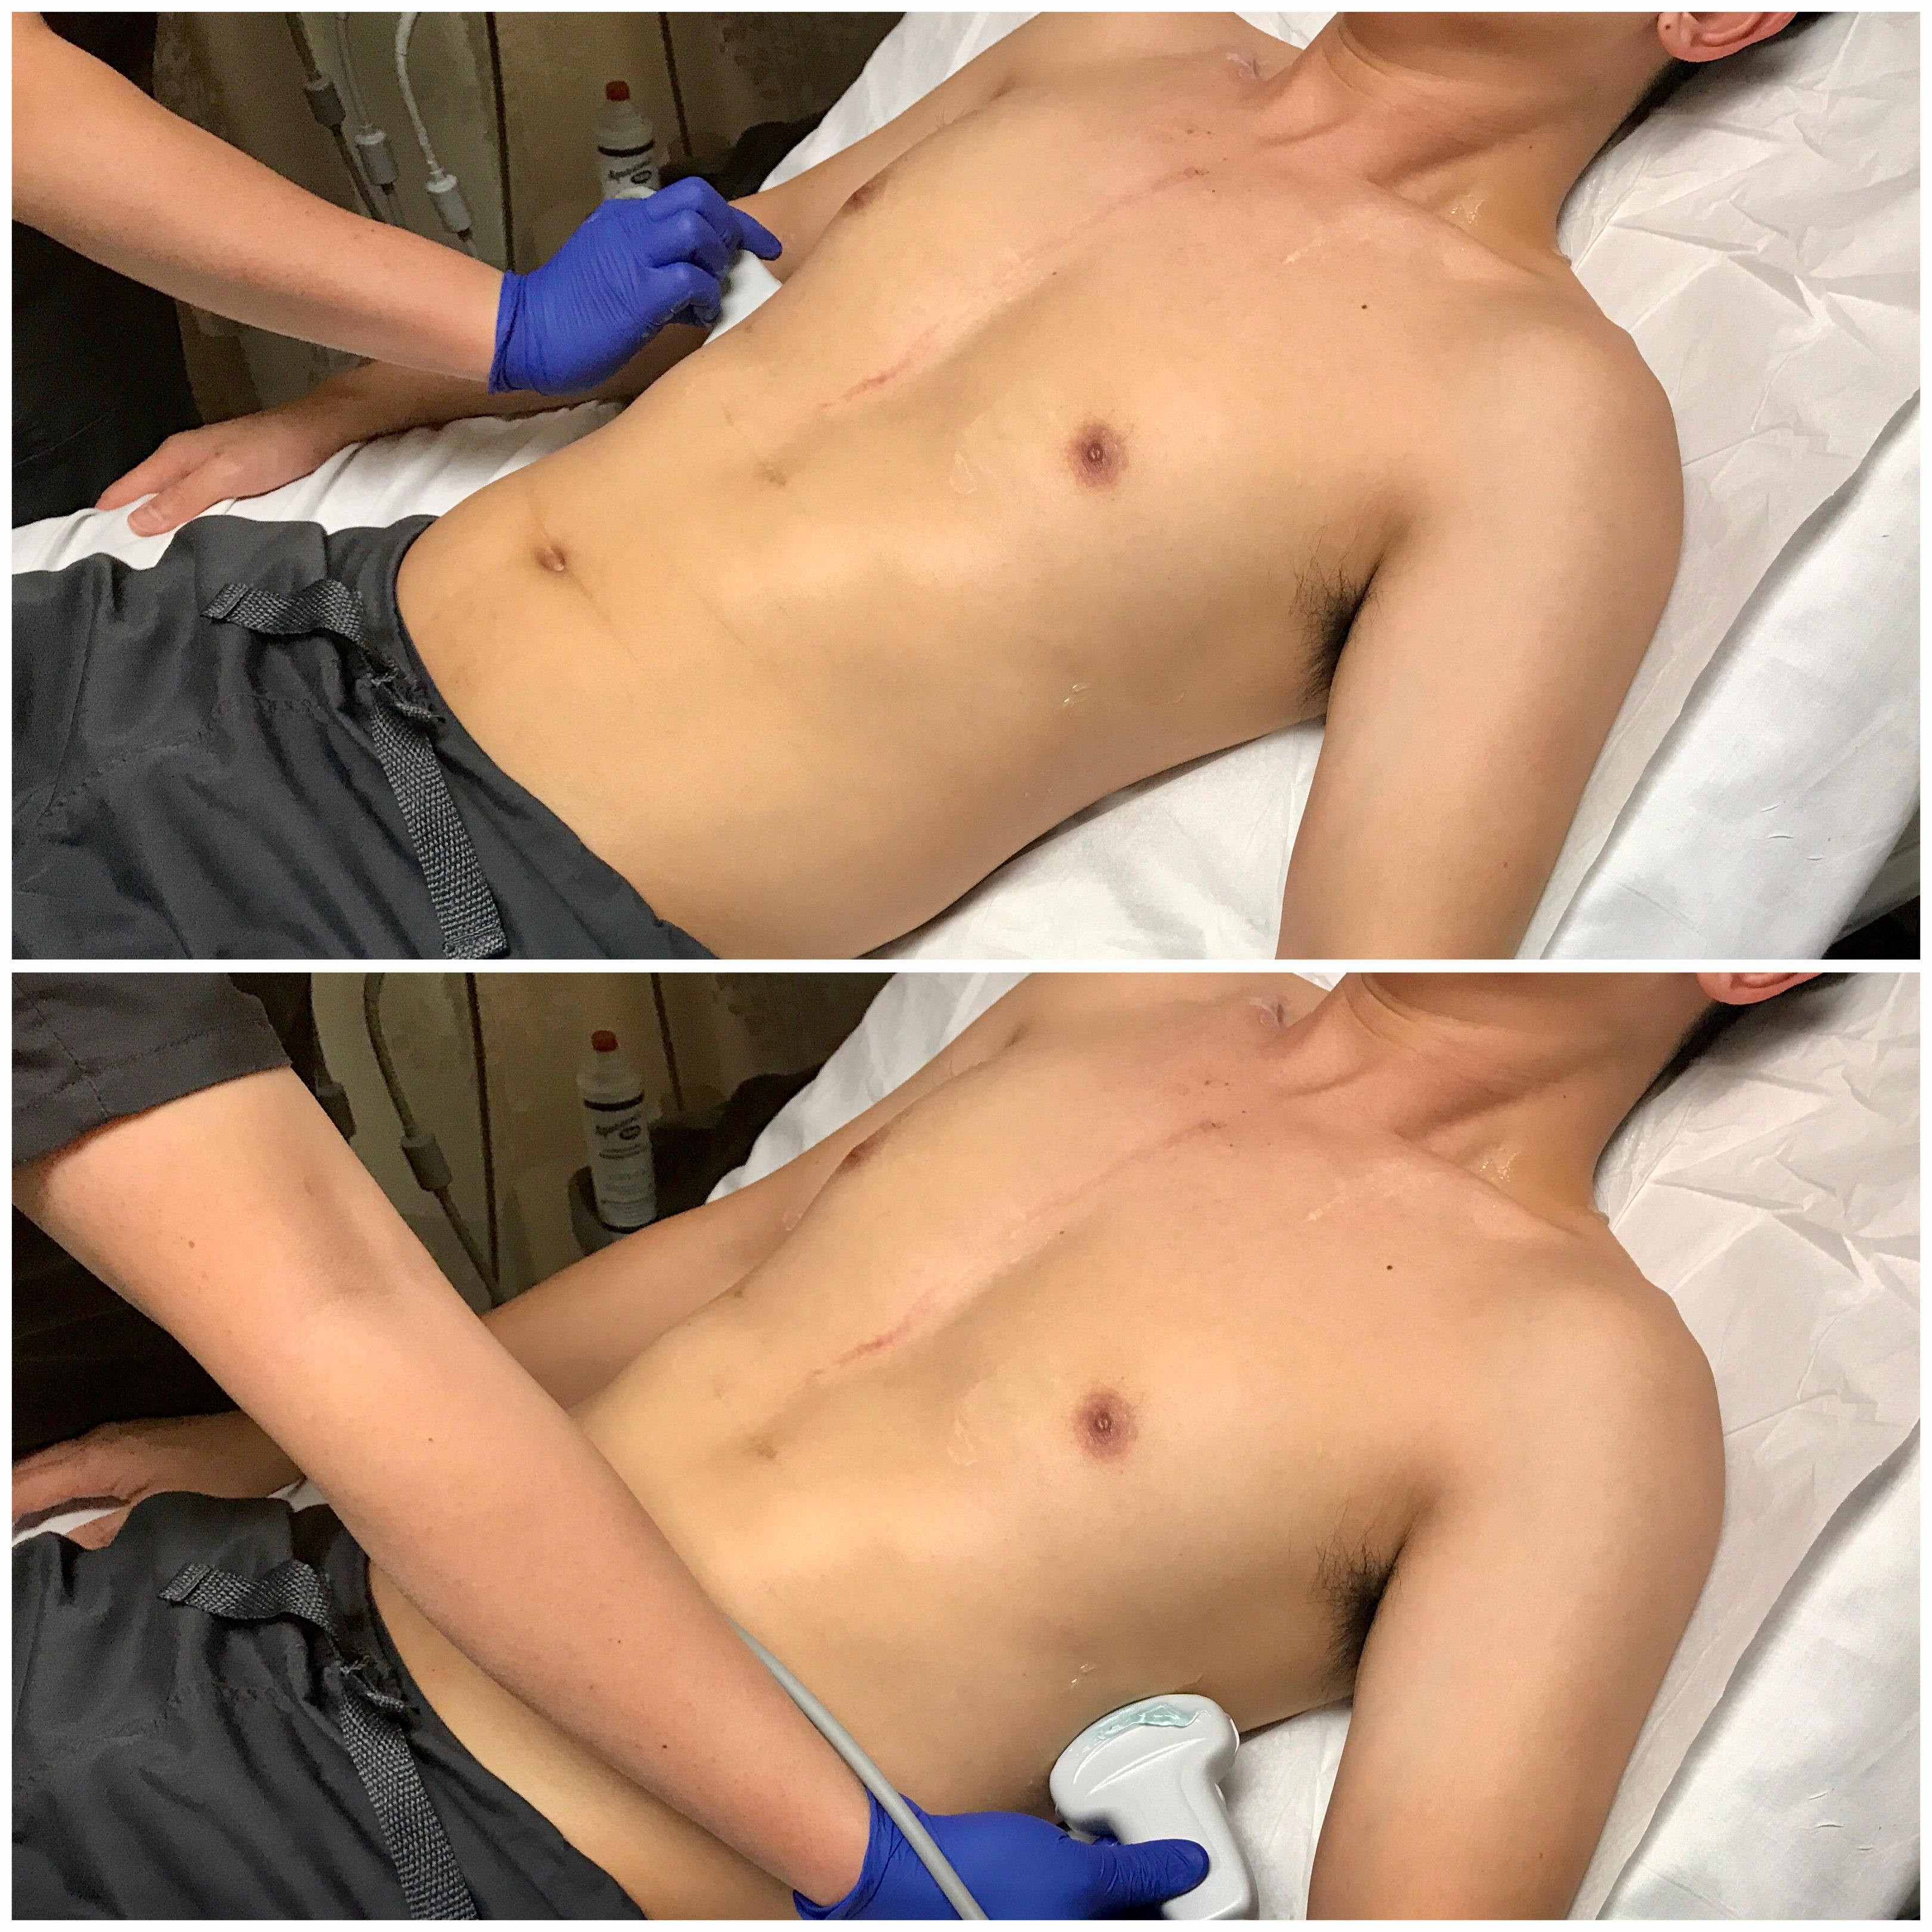
- Evaluating for Pneumothorax
- The high-frequency (5-10 MHz) linear transducer is best for evaluating the shallower VPPI, though the low-frequency (3-5 MHz) curvilinear transducer may also be used.
- Air will accumulate in the least gravitationally dependent areas. Thus, in a supine patient, place the transducer longitudinally over the mid-clavicular line in the 3rd-4th intercostal space for best sensitivity. (Image 11) Scan in more than one intercostal space to ensure evaluation of the most non-dependent region.
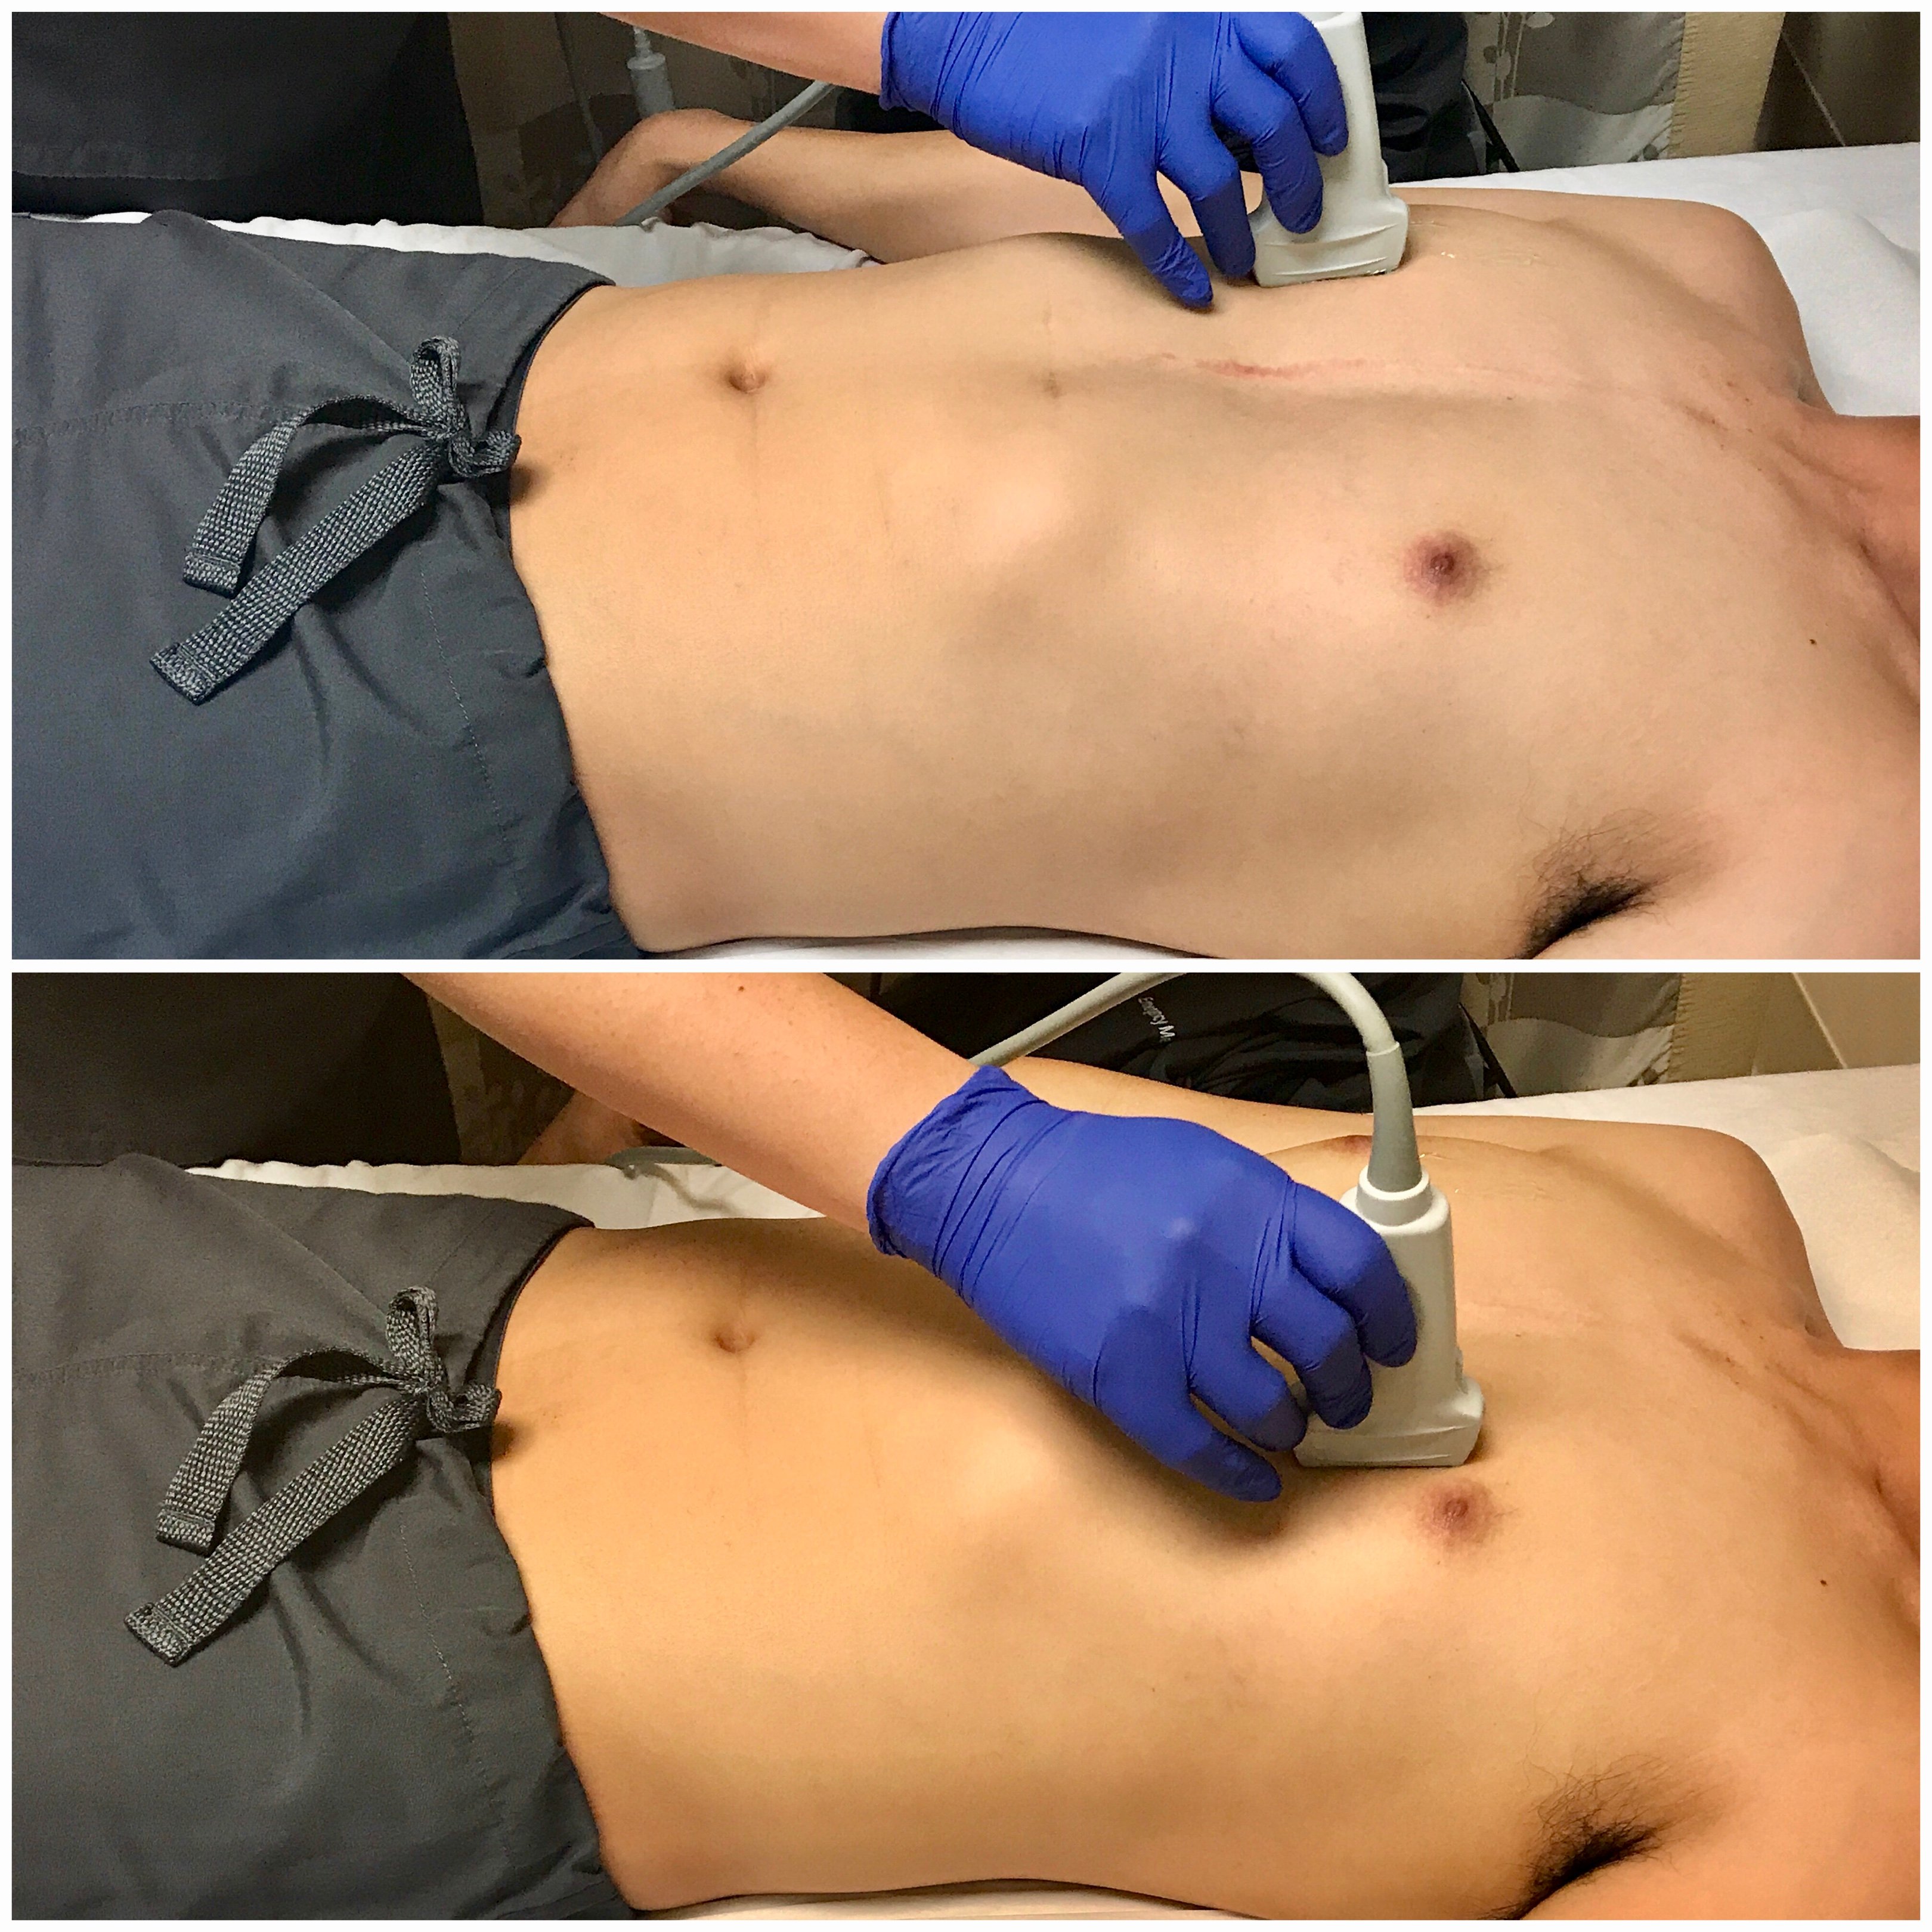
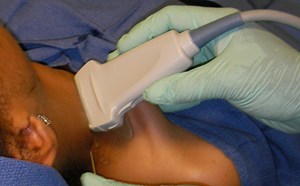
- Figure 11. Transducer placement and orientation for evaluating for pneumothorax in the supine patient
- Rotate the transducer into the transverse plane and slide laterally to locate the lung point and delineate the size of the PTX.
- If the patient cannot lay supine and remains upright, you may place the transducer over the apex. However, the apex has minimal vertical movement with respiration, and lung sliding is thus less pronounced. This may lead to risk of a missed small PTX.10
- Subcutaneous emphysema or a large pleural effusion prevent visualization of the pleural interface.
Evaluating for Alveolar-Interstitial Syndrome
- The low-frequency (3-5 MHz) curvilinear transducer allows for a broad sonographic window, though the high-frequency (5-10 MHz) linear transducer may also be used.
- International recommendations suggest scanning in 8 regions,10,18 (Image 12) although a more rapid anterior 2-region approach may be sufficient in evaluating for cardiogenic pulmonary edema and when time is limited.7, 10
- Figure 12. 8-zone protocol
- Evaluating for Pleural Effusion
- The low-frequency (3-5 MHz) curvilinear transducer allows for a broad sonographic window and can visualize deeper structures, though the phased-array transducer may also be used to navigate between the rib spaces.
- Fluid is gravitationally dependent and accumulates in the costophrenic angles. Thus, raising the head of the bed even slightly may increase sensitivity.
- In both the upright and supine patient, scan bilaterally along the posterior axillary lines above the diaphragm.
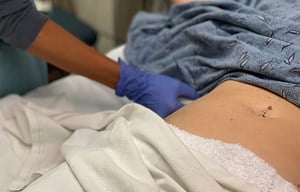
- Figure 13. Transducer placement and orientation or evaluating for pleural effusion in the semi-upright patient
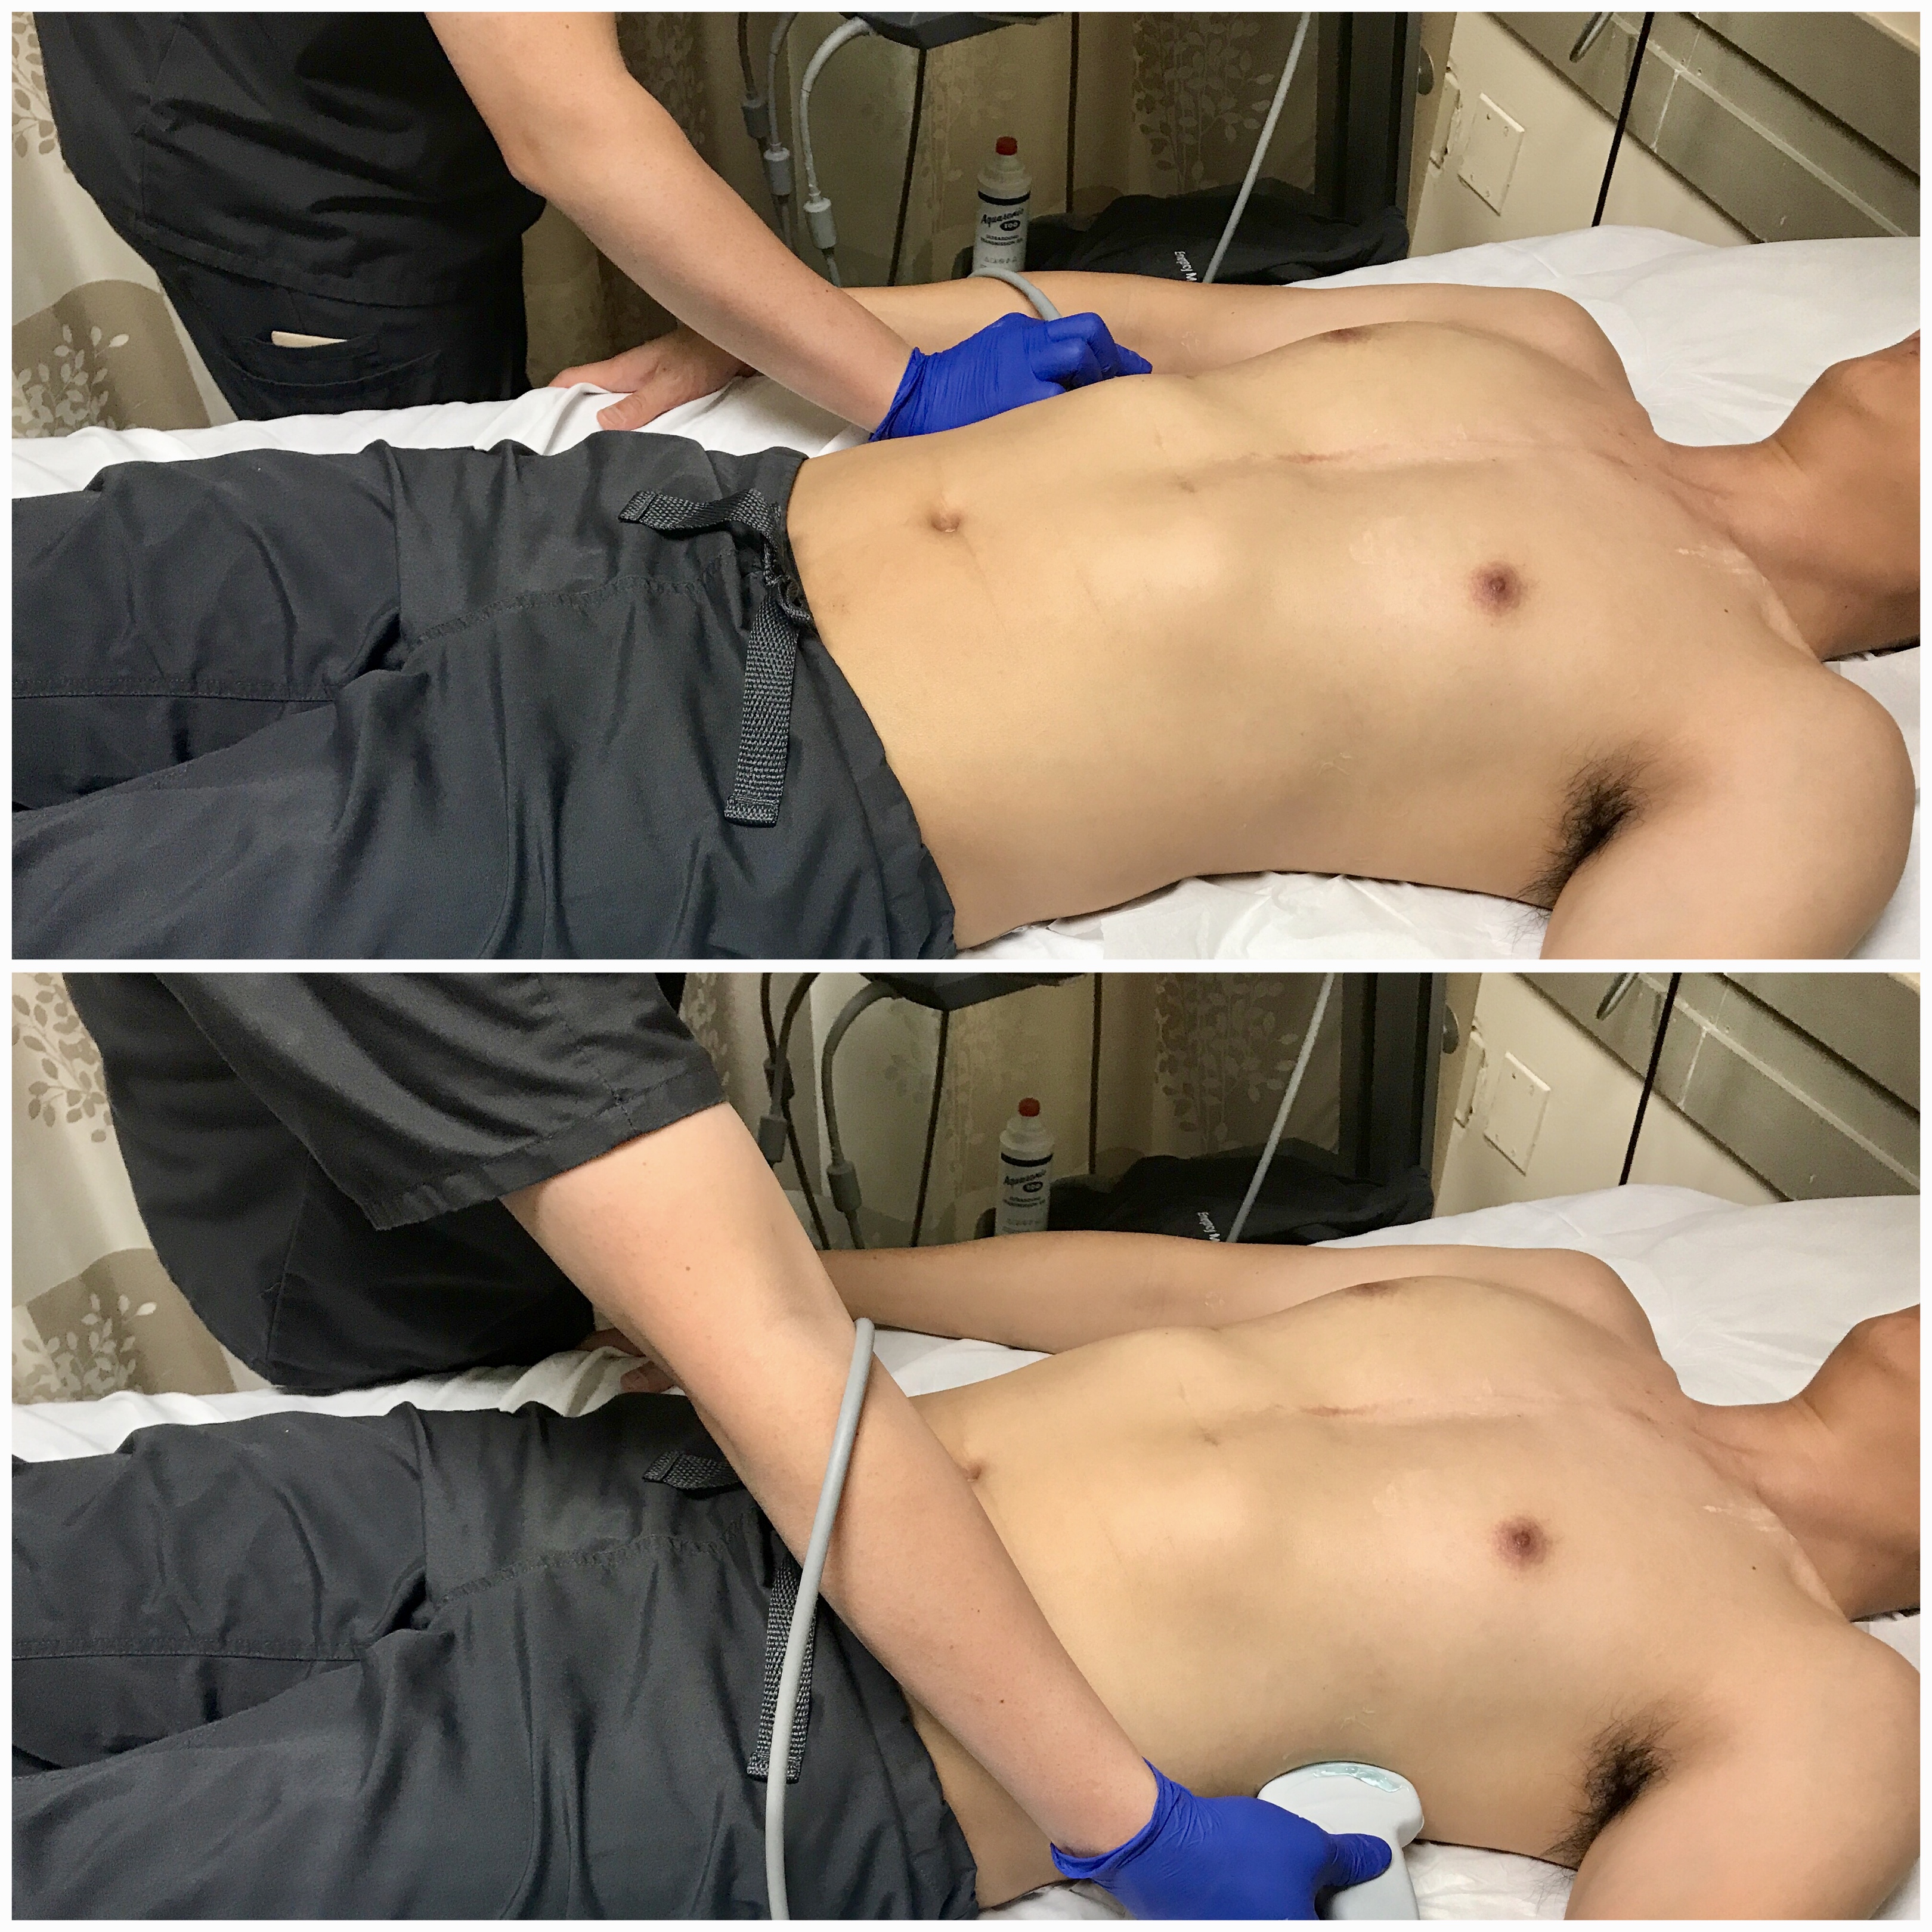
- Figure 14. Transducer placement and orientation or evaluating for pleural effusion in the supine patient
- Mirror image artifact60
- Sound waves reflect off the highly reflective diaphragm, encounter liver tissue, are reflected back to the diaphragm, and then return to the transducer. Based on the time taken for the sound waves to return to the transducer, the machine incorrectly assumes that the initial beam traveled along a linear path and reached the liver tissue deep to the diaphragm. The liver is thus mapped falsely in the deeper location.
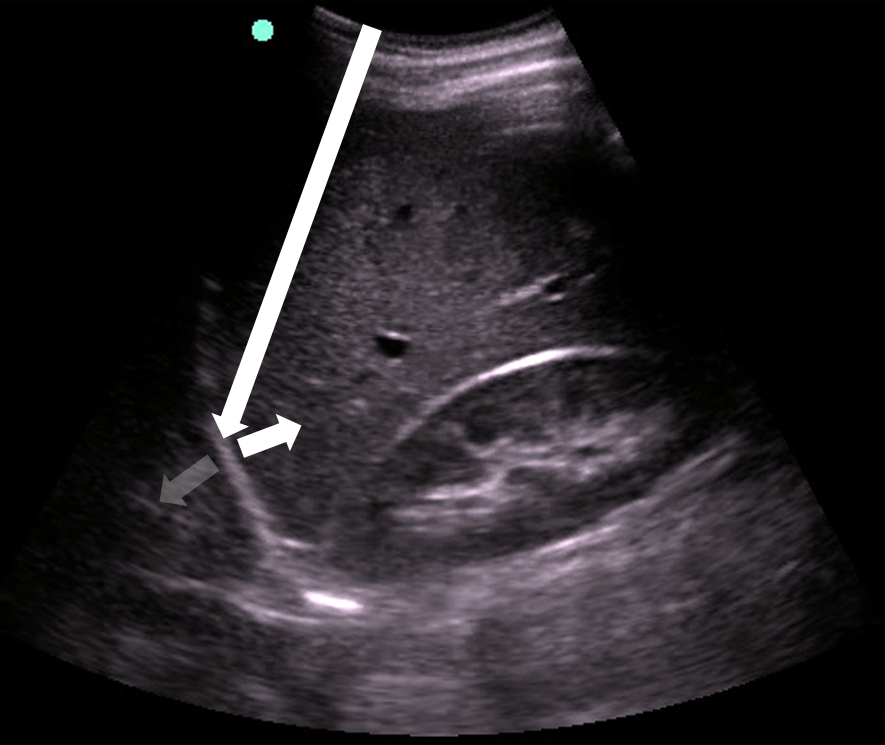
- Figure 15. Mirror image artifact
- Evaluating for Lung Consolidation
- The low-frequency (3-5 MHz) curvilinear transducer can evaluate deeper into the lung parenchyma with a broad sonographic window. In children and thin adults, the high-frequency (5-10 MHz) linear transducer may be used.
- Dividing each hemi-thorax into anterior, lateral, and posterior regions, scan in lawnmower fashion in both the sagittal and transverse planes. (Video 7)
- Anterior segment: bound by sternum, clavicle, and anterior axillary line.
- Lateral segment: bound by the anterior and posterior axillary lines.
- Posterior segment: bound by posterior axillary line and vertebral column.
Video 7. Evaluating for consolidation
Pathology
Pneumothorax
- Sonographic signs include:10,11
- Absence of lung sliding
- Video 8. Absence of lung sliding
- Figure 16. Stratosphere sign in M-mode
- Air within pleural space scatters the sound waves. The stationary parietal pleura attached to the chest wall is still visualized, but the visceral pleura is not.
- Highly sensitive but not specific for PTX11,58
- Other etiologies: mainstem intubation, COPD blebs,62 prior pleurodesis, apnea, severe atelectasis or consolidation, ARDS, pulmonary contusion, severe fibrosis, phrenic nerve palsy63
- Absence of lung sliding
- False-positives:
- Interface between lung and abdominal organs
- Video 9. Curtain sign over the interface between lung, diaphragm, and liver
- Absence of B-lines
- Would arise from visceral pleura
- Even a single B-line artifact excludes PTX64
- Lung point
- The dynamic boundary point where the visceral and parietal pleura reattach.
- Visible as two distinct patterns on the sonographic window (Video 10: Lung point) (Image 17: Lung point in M-mode)
- Video 10. Lung point
- Figure 17. Lung point in M-mode
- Very specific for PTX65
- Absence of lung point
- Also occurs with apnea, pharmacologic paralysis, massive atelectasis, consolidation, and mainstem intubation11,58
- Location of lung point correlates with extent of PTX.66-69
- Anterior lung point: radio-occult PTX
- Lateral lung point: substantial PTX
- Posterior lung point: massive PTX
- Absent lung point: complete lung collapse
- Patients receiving positive-pressure ventilation have 3x the risk and those with respiratory distress have 6x the risk of failing observation for small PTX. Those with PTX progression are 70x more likely to undergo tube thoracostomy.70 This reflects the importance of serial evaluations of a small PTX.
- Interface between lung and abdominal organs
Alveolar-Interstitial Syndrome
- “B-pattern:” 2+ regions bilaterally with ≥ 3 B-lines within an intercostal space18,19
- Video 11. B-pattern
- Causes: pulmonary edema, interstitial pneumonia or pneumonitis, pulmonary contusion, diffuse parenchymal lung disease
- Number of B lines correlates with density of fluid in interlobular septa1,18,19,71-74
- B-lines decrease and eventually disappear with therapy (diuresis, non-invasive ventilation, dialysis)75-77
Pleural Effusion
- Anechoic space between parietal and visceral pleura78
- Video 12. Pleural effusion
- Normal air-filled lung is replaced by liquid-dense effusion, which now allows propagation of sound waves.
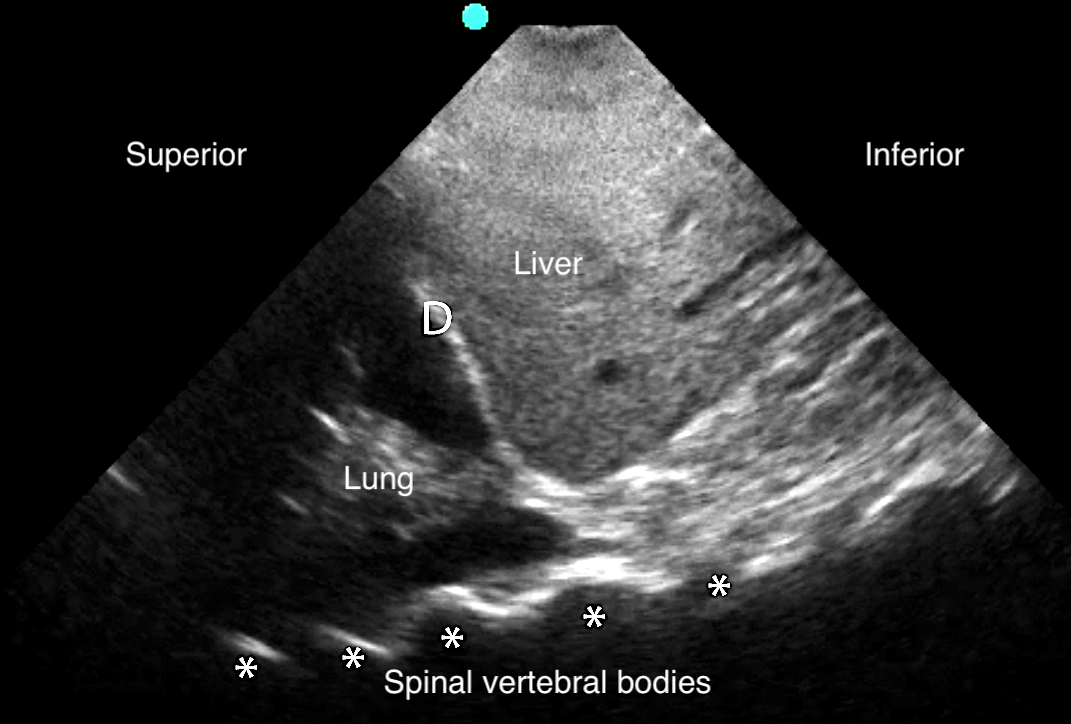
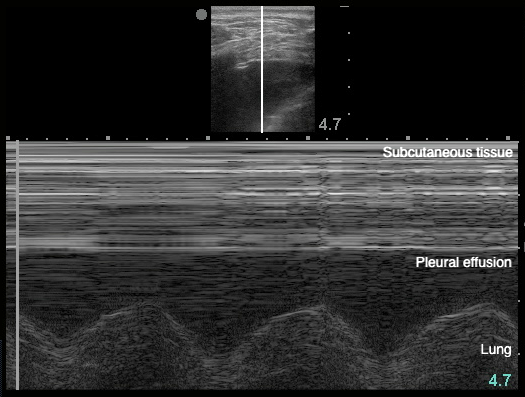
- Figure 18. Pleural effusion with spine sign
- Quad sign delineates four boundaries: superior and inferior rib shadows, superficial parietal pleura, and the deeper visceral pleura.
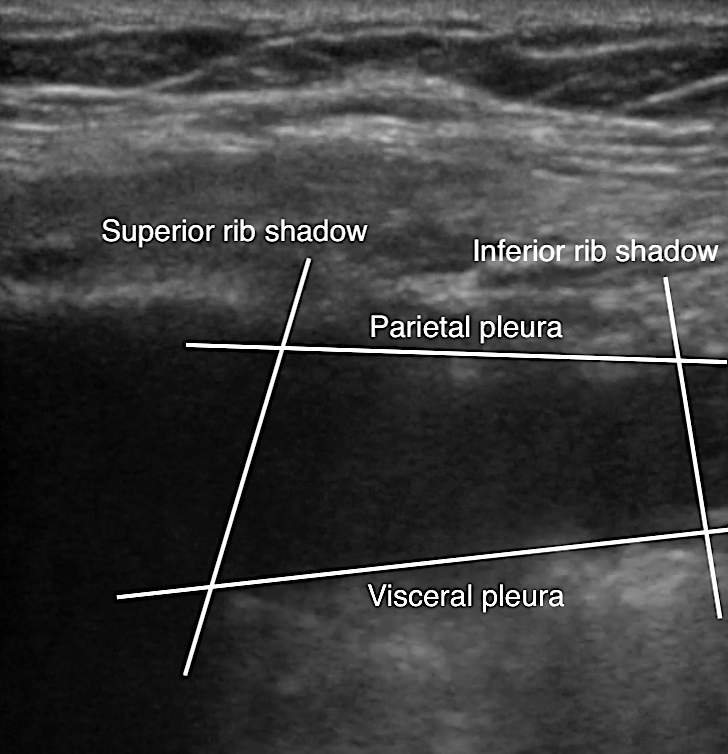
- Figure 19. Pleural effusion with quad sign
- Internal echoes within the effusion suggest exudate or hemothorax.79
- Video 13. Hemothorax
- Complex effusions are seen as heterogeneous fluid collections with interspersed hyperechoic tissue strands. (Video 14)
- Can be described as complex septated, complex non-septated, or homogenous septated.80
- Septations seen with higher accuracy than with CT81
- Video 14. Pleural effusion with septations
- Empyema will have complex loculations and bright echogenic traces82
- Sinusoid sign: represents movement of lung within the effusion22
- Figure 20. Sinusoid sign
- Demonstrates fluctuating distance between visceral and parietal pleura during respiratory cycle
- Volume of the effusion can be measured,28,83-85 more effectively than with CXR.28 A quick and easy method uses the largest distance between parietal and visceral pleura at end-expiration.83
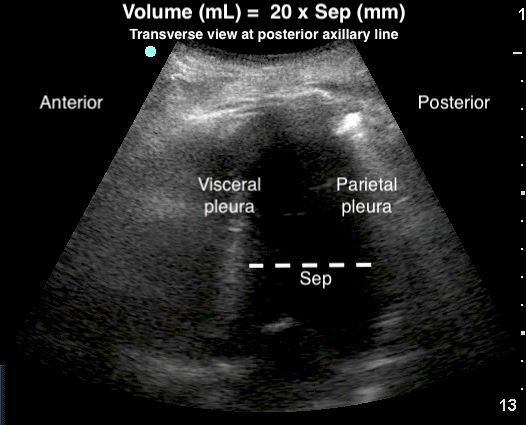
- Figure 21. Estimation of pleural effusion volume
- Pleural thickening > 1 cm, pleural nodularity, and diaphragmatic thickening > 7 mm are suggestive of malignant pleural effusion.86
- Thoracentesis can be guided safely by LUS in real-time.87 Chest tube placement can be confirmed via B-mode and/or M-mode.89
Pneumonia
- Subpleural, irregular, non-homogenous hypoechoic or tissue-like consolidation with blurred margins that disrupts the pleural line.
- Video 15. Consolidation with shred sign and air bronchograms
- Video 16. Consolidation with shred sign and air bronchograms zoomed-in
- Consolidation of interstitial space into liver-like appearance (“hepatization”) that allows for sound wave transmission and focal B-lines at the far field of the consolidation.18,19
- Video 17. Lung hepatization with focal B-pattern
- Consolidations become progressively more heterogenous.90
- Dynamic air bronchograms: Bronchi remain patent in supplying the consolidated lung. Air bubbles moving into the bronchi with respiration generate linear branching hyperechoic lines running within the consolidation.91-94
- Video 18. Consolidation with dynamic air bronchograms
- Vascularity: uniformly increased using color Doppler,95 compared to pulmonary infarct from pulmonary embolism
- Pleural effusion in more than 1/3 of cases96,97
- Video 19. Consolidation with parapneumonic effusion
- Lung abscess: round or oval anechoic lesions with smooth echogenic capsule and blurred internal echoes
- Abuts pleura in 85.5% of cases.34,93
- Otherwise, LUS cannot rule out consolidations that do not reach the pleura
- Found predominantly in dependent and posterior lung regions37
- May represent whole-lung consolidation when appearing anteriorly34
Pulmonary Embolism
- Pulmonary infarct appears as a subpleural homogenous wedge-shaped consolidation with a 0.5-7 cm pleural interruption, sharp margins, and no internal vascularity or air bronchograms.98-101
- Video 20. Subpleural infarct from pulmonary embolism
- Only lesions extending to pleural line can be visualized
- Represents the downstream effect of pulmonary artery occlusion
- Alternate diagnostic tool when CT is contraindicated or unavailable
Pulmonary Contusion
- Defined by two types of findings:41
- Mild: alveolar-interstitial B-pattern102
- Severe: subpleural consolidations
- Size of contusion in relation to total lung volume correlates to the risk of ARDS.103
Atelectasis
- Subpleural echo-poor regions of tissue-like echotexture (due to loss of aeration) with deep margins
- Video 21. Atelectasis
- Static air bronchograms:48
- Atelectasis causes bronchial plugging. Thus, unlike with PNA, air bubbles do not enter the bronchi with inspiration.
- Absent lung sliding, with unmasking of the underlying lung pulse due to lack of local respiratory movement48-52, 54-58
- Visualized immediately after left mainstem bronchus intubation, inhaled obstructive foreign body, or temporary voluntary apnea
- Compared to being a delayed finding on CXR58
- Air trapped within lung is absorbed progressively, not suddenly
- Loss of lung volume and subsequent attraction of nearby organs
Acute Respiratory Distress Syndrome
- The following signs are strongly predictive of ARDS, in comparison to cardiogenic pulmonary edema:51 (Video 22)
- Non-homogenous B-pattern distribution
- Pleural line modifications
- Irregular, coarse, thickened (>2 mm)
- Reduction or absence of lung sliding, with unmasking of lung pulse
- Spared areas of normal parenchyma
- Subpleural consolidations with air bronchograms
-
Video 22. Non-homogenous B-pattern distribution with spared areas and pleural thickening suggestive of ARDS
- A “triple scan” protocol has been suggested to assist in the differentiation between ARDS and cardiogenic pulmonary edema:52
- Echocardiography for gross ejection fraction
- Anterior lung field assessment for B-pattern
- Inferior vena cava (IVC) diameter for respiratory variation
- Lung morphology (focal or diffuse aeration loss) may be considered when optimizing positive end-expiratory pressure.104
References
- Lichtenstein D. Lung ultrasound in the critically ill. Curr Opin Crit Care. 2014. 20(3):315-22.
- Copetti R, Cattarossi L. Ultrasound diagnosis of pneumonia in children. Radiol Med. 2008. 113(2): p. 190-8.
- Lichtenstein DA. Ultrasound examination of the lungs in the intensive care unit. Pediatr Crit Care Med. 2009;10(6):693-8.
- Coley BD. Pediatric chest ultrasound. Radiol Clin North Am. 2005;43(2):405-18.
- Riccabona M. Ultrasound of the chest in children (mediastinum excluded). Eur Radiol. 2008;18(2)390-9.
- Iuri D, De Candia A, Bazzocchi M. Evaluation of the lung in children with suspected pneumonia: usefulness of ultrasonography. Radiol Med. 2009;114(2):321-30.
- Lichtenstein DA, Mezière GA. Relevance of lung ultrasound in the diagnosis of acute respiratory failure: the BLUE protocol. Chest. 2008;134(1):117-25.
- Zanobetti M, Scorpiniti M, Gigli C, et al. Point-of-care ultrasonography for evaluation of acute dyspnea in the ED. Chest. 2017;151(6):1295-1301.
- Laursen CB, et al., Point-of-care ultrasonography in patients admitted with respiratory symptoms: a single-blind, randomised controlled trial. Lancet Respir Med. 2014;2(8):638-46.
- Volpicelli G, Elbarbary M, Blaivas M, et al. International evidence-based recommendations for point-of-care lung ultrasound. Intensive Care Med. 2012;38(4):577-91.
- Volpicelli G. Sonographic diagnosis of pneumothorax. Intensive Care Med. 2011;37(2):224-32.
- Blaivas M, Lyon M, Duggal S. A prospective comparison of supine chest radiography and bedside ultrasound for the diagnosis of traumatic pneumothorax. Acad Emerg Med. 2005;12(9):844-9.
- Zhang M, Liu ZH, Yang JX, et al. Rapid detection of pneumothorax by ultrasonography in patients with multiple trauma. Crit Care. 2006;10(4):R112.
- Soldati G, Testa A, Pignataro G, et al. The ultrasonographic deep sulcus sign in traumatic pneumothorax. Ultrasound Med Biol. 2006;32(8):1157-63.
- Soldati G, Testa A, Sher S, et al. Occult traumatic pneumothorax: diagnostic accuracy of lung ultrasonography in the emergency department. Chest. 2008;133(1):204-11.
- Lichtenstein DA, Menu Y. A bedside ultrasound sign ruling out pneumothorax in the critically ill. Lung sliding. Chest. 1995;108(5):1345-8.
- Rowan KR, Kirkpatrick AW, Liu D, et al. Traumatic pneumothorax detection with thoracic US: correlation with chest radiography and CT--initial experience. Radiology. 2002;225(1):210-4.
- Volpicelli G, Mussa A, Garofalo G, et al. Bedside lung ultrasound in the assessment of alveolar-interstitial syndrome. Am J Emerg Med. 2006;24(6):689-96.
- Lichtenstein D, Mézière G, Biderman P, et al. The comet-tail artifact. An ultrasound sign of alveolar-interstitial syndrome. Am J Respir Crit Care Med. 1997;156(5):1640-6.
- Torino C, Gargani L, Sicari R, et al. The Agreement between Auscultation and Lung Ultrasound in Hemodialysis Patients: The LUST Study. Clin J Am Soc Nephrol. 2016;11(11):2005-2011.
- Kocijancic I, Vidmar K, Ivanovi-Herceg Z. Chest sonography versus lateral decubitus radiography in the diagnosis of small pleural effusions. J Clin Ultrasound. 2003;31(2):69-74.
- Lichtenstein D, Hulot JS, Rabiller A, et al. Feasibility and safety of ultrasound-aided thoracentesis in mechanically ventilated patients. Intensive Care Med. 1999;25(9):955-8.
- Mumtaz U, Zahur Z, Raza MA, et al. Ultrasound and supine chest radiograph in road traffic accident patients: A reliable and convenient way to diagnose pleural effusion. J Ayub Med Coll Abbottabad. 2017;29(4):587-590.
- Rocco M, Carbone I, Morelli A, et al. Diagnostic accuracy of bedside ultrasonography in the ICU: feasibility of detecting pulmonary effusion and lung contusion in patients on respiratory support after severe blunt thoracic trauma. Acta Anaesthesiol Scand. 2008;52(6):776-84.
- Grimberg A, Shigueoka DC, Atallah AN, et al. Diagnostic accuracy of sonography for pleural effusion: systematic review. Sao Paulo Med J. 2010;128(2):90-5.
- Kataoka H, Takada S. The role of thoracic ultrasonography for evaluation of patients with decompensated chronic heart failure. J Am Coll Cardiol. 2000;35(6):1638-46.
- Lichtenstein D, Goldstein I, Mourgeon E, et al. Comparative diagnostic performances of auscultation, chest radiography, and lung ultrasonography in acute respiratory distress syndrome. Anesthesiology. 2004;100(1):9-15.
- Eibenberger KL, Dock WI, Ammann ME, et al. Quantification of pleural effusions: sonography versus radiography. Radiology. 1994;191(3):681-4.
- Röthlin MA, Näf R, Amgwerd M, et al. Ultrasound in blunt abdominal and thoracic trauma. J Trauma. 1993;34(4):488-95.
- Juhl J, Crummy A, Kuhlman J. (1998) Essentials of Radiologic Imaging. 7th ed. Lippincott Williams & Wilkins.
- Parlamento S, Copetti R, Di Bartolomeo S. Evaluation of lung ultrasound for the diagnosis of pneumonia in the ED. Am J Emerg Med. 2009;27(4):379-84.
- Volpicelli G, Cardinale L, Berchialla P, et al. A comparison of different diagnostic tests in the bedside evaluation of pleuritic pain in the ED. Am J Emerg Med. 2012;30(2):317-24.
- Ellington LE, Gilman RH, Chavez MA, et al. Lung ultrasound as a diagnostic tool for radiographically-confirmed pneumonia in low resource settings. Respir Med. 2017;128:57-64.
- Lichtenstein DA, Lascols N, Mezière G, et al. Ultrasound diagnosis of alveolar consolidation in the critically ill. Intensive Care Med. 2004;30(2):276-281.
- Cortellaro F, Colombo S, Coen D, et al. Lung ultrasound is an accurate diagnostic tool for the diagnosis of pneumonia in the emergency department. Emerg Med J. 2012;29(1):19-23.
- Samson F, Gorostiza I, González A, et al. Prospective evaluation of clinical lung ultrasonography in the diagnosis of community-acquired pneumonia in a pediatric emergency department. Eur J Emerg Med. 2018;25(1):65-70.
- Milliner BHA, Tsung JW. Lung consolidation locations for optimal lung ultrasound scanning in diagnosing pediatric pneumonia. J Ultrasound Med. 2017;36(11):2325-2328.
- Shah VP, Tunik MG, Tsung JW. Prospective evaluation of point-of-care ultrasonography for the diagnosis of pneumonia in children and young adults. JAMA Pediatr. 2013;167(2):119-25.
- Nazerian P, Vanni S, Volpicelli G, et al. Accuracy of point-of-care multiorgan ultrasonography for the diagnosis of pulmonary embolism. Chest. 2014;145(5):950-957.
- Nazerian P, Volpicelli G, Gigli C, et al. Diagnostic performance of Wells Score combined with point-of-care lung and venous ultrasound in suspected pulmonary embolism. Acad Emerg Med. 2017;24(3):270-280.
- Soldati G, Testa A, Silva FR, et al. Chest ultrasonography in lung contusion. Chest. 2006;130(2):533-8.
- Aukema TS, et al. Initial assessment of chest X-ray in thoracic trauma patients: Awareness of specific injuries. World J Radiol. 2012;4(2):48-52.
- Cohn SM. Pulmonary contusion: review of the clinical entity. J Trauma. 1997;42(5):973-9.
- Tyburski JG, Collinge D, Wilson RF, et al. Pulmonary contusions: quantifying the lesions on chest X-ray films and the factors affecting prognosis. J Trauma. 1999;46(5):833-8.
- Yu X, Zhai Z, Zhao Y, et al. Performance of lung ultrasound in detecting peri-operative atelectasis after general anesthesia. Ultrasound Med Biol. 2016;42(12):2775-84.
- Yang JX, Zhang M. Detection of lung atelectasis/consolidation by ultrasound in multiple trauma patients with mechanical ventilation. Crit Ultrasound J. 2009;1(1):13-6.
- Acosta CM, Tusman G, Jacovitti D, et al, Anesthesia-induced atelectasis assessed by lung sonography. Crit Ultrasound J. 2014;6(Suppl 1):A13.
- Acosta CM, Maidana GA, Jacovitti D, et al. Accuracy of transthoracic lung ultrasound for diagnosing anesthesia-induced atelectasis in children. Anesthesiology. 2014;120(6):1370-9.
- Pesenti A, Tagliabue P, Patroniti N, et al. Computerised tomography scan imaging in acute respiratory distress syndrome. Intensive Care Med. 2001;27(4):631-9.
- Sekiguchi H, et al. Critical care ultrasonography differentiates ARDS, pulmonary edema, and other causes in the early course of acute hypoxemic respiratory failure. Chest. 2015;148(4):912-918.
- Copetti R, Soldati G, Copetti P. Chest sonography: a useful tool to differentiate acute cardiogenic pulmonary edema from acute respiratory distress syndrome. Cardiovasc Ultrasound. 2008;6:16.
- Mantuani D, Nagdev A, Stone M. Three-view bedside ultrasound for the differentiation of acute respiratory distress syndrome from cardiogenic pulmonary edema. Am J Emerg Med. 2012;30(7):1324 e1-4.
- Amador C, Weber C, Varacallo M. Anatomy, Thorax, Bronchial. [Updated 2020 Aug 10]. In: StatPearls [Internet]. Treasure Island (FL): StatPearls Publishing; 2020 Jan-. [Figure, The Trachea and Bronchi, Bronchi and bronchioles. Contributed by Gray's Anatomy Plates] Available from: https://www.ncbi.nlm.nih.gov/books/NBK537353/figure/article-30998.image.f1/
- Lichtenstein D, Mezière G. A lung ultrasound sign allowing bedside distinction between pulmonary edema and COPD: the comet-tail artifact. Intensive Care Med. 1998;24(12):1331-4.
- Lichtenstein D, Axler O. Intensive use of general ultrasound in the intensive care unit. Prospective study of 150 consecutive patients. Intensive Care Med. 1993;19(6):353-5.
- Cardinale L, Volpicelli G, Binello F, et al. Clinical application of lung ultrasound in patients with acute dyspnea: differential diagnosis between cardiogenic and pulmonary causes. Radiol Med. 2009;114(7):1053-64.
- Volpicelli G, Cardindale L, Garofalo G, et al. Usefulness of lung ultrasound in the bedside distinction between pulmonary edema and exacerbation of COPD. Emerg Radiol. 2008;15(3):145-51.
- Lichtenstein DA, Lascols N, Prin S, et al. The "lung pulse:" an early ultrasound sign of complete atelectasis. Intensive Care Med. 2003;29(12):2187-92.
- Gargani L. Interstitial syndrome. Thoracic Ultrasound (ERS Monograph), ed. C. Laursen, N. Rahman, and G. Volpicelli. 2018, Sheffield: European Respiratory Society.
- Alerhand S, Graumann O, NelsonB. Physics and basic principles. Thoracic Ultrasound (ERS Monograph), ed. C.B. Laursen, N.M. Rahman, and G. Volpicelli. 2018, Sheffield: European Respiratory Monograph.
- Cunningham J, Kirkpatrick AW, Nicolaou S, et al. Enhanced recognition of "lung sliding" with power color Doppler imaging in the diagnosis of pneumothorax. J Trauma. 2002;52(4):769-71.
- Slater A, Goodwin M, Anderson KE, et al. COPD can mimic the appearance of pneumothorax on thoracic ultrasound. Chest. 2006;129(3):545-50.
- Blanco P, Volpicelli G. Common pitfalls in point-of-care ultrasound: a practical guide for emergency and critical care physicians. Crit Ultrasound J. 2016;8(1):15.
- Lichtenstein D, Mezière G, Biderman P, et al. The comet-tail artifact: an ultrasound sign ruling out pneumothorax. Intensive Care Med. 1999;25(4):383-8.
- Lichtenstein D, Mezière G, Biderman P, et al. The "lung point": an ultrasound sign specific to pneumothorax. Intensive Care Med. 2000;26(10):1434-40.
- Lichtenstein DA, Mezière G, Lascols N, et al. Ultrasound diagnosis of occult pneumothorax. Crit Care Med. 2005;33(6):1231-8.
- Lichtenstein D. Novel approaches to ultrasonography of the lung and pleural space: where are we now? Breathe (Sheff). 2017;13(2):100-111.
- Oveland NP, Lossius HM, Wemmelund K, et al. Using thoracic ultrasonography to accurately assess pneumothorax progression during positive pressure ventilation: a comparison with CT scanning. Chest. 2013;143(2):415-422.
- Volpicelli G, Boero E, Sverzellati N, et al. Semi-quantification of pneumothorax volume by lung ultrasound. Intensive Care Med. 2014;40(10):1460-7.
- Moore FO, et al. Blunt traumatic occult pneumothorax: is observation safe?--results of a prospective, AAST multicenter study. J Trauma. 2011;70(5):1019-23; discussion 1023-5.
- Agricola E, Bove T, Oppozzo M, et al. "Ultrasound comet-tail images": a marker of pulmonary edema: a comparative study with wedge pressure and extravascular lung water. Chest. 2005;127(5):1690-5.
- Frassi F, Gargani L, Tesorio P, et al. Prognostic value of extravascular lung water assessed with ultrasound lung comets by chest sonography in patients with dyspnea and/or chest pain. J Card Fail. 2007;13(10):830-5.
- Anile A, et al. A simplified lung ultrasound approach to detect increased extravascular lung water in critically ill patients. Crit Ultrasound J. 2017;9(1):13.
- Allinovi M, Saleem M, Romagnani P, et al. Lung ultrasound: a novel technique for detecting fluid overload in children on dialysis. Nephrol Dial Transplant. 2017;32(3):541-7.
- Volpicelli G, et al. Bedside ultrasound of the lung for the monitoring of acute decompensated heart failure. Am J Emerg Med. 2008;26(5):585-91.
- Liteplo AS, et al. Real-time resolution of sonographic B-lines in a patient with pulmonary edema on continuous positive airway pressure. Am J Emerg Med. 2010;28(4):541 e5-8.
- Noble VE, Murray AF, Capp R, et al. Ultrasound assessment for extravascular lung water in patients undergoing hemodialysis. Time course for resolution. Chest. 2009;135(6):1433-9.
- Atkinson P, Milne J, Loubani O, et al. The V-line: a sonographic aid for the confirmation of pleural fluid. Crit Ultrasound J. 2012;4(1):19.
- Yang PC, Luh KT, Chang DB, et al. Value of sonography in determining the nature of pleural effusion: analysis of 320 cases. AJR Am J Roentgenol. 1992;159(1):29-33.
- Merrick C, et al. Pleural effusion. Thoracic Ultrasound (ERS Monograph), ed. CB Laursen, N. Rahman, and G. Volpicelli. 2018, Sheffield: European Respiratory Monograph.
- Kearney SE, Davies CW, Davies RJ, et al. Computed tomography and ultrasound in parapneumonic effusions and empyema. Clin Radiol. 2000;55(7):542-7.
- Reissig A, Copetti R, Kroegel C. Current role of emergency ultrasound of the chest. Crit Care Med. 2011;39(4):839-45.
- Balik M, Plasil P, Waldauf P, et al. Ultrasound estimation of volume of pleural fluid in mechanically ventilated patients. Intensive Care Med. 2006;32(2):318.
- Roch A, Bojan M, Michelet P, et al. Usefulness of ultrasonography in predicting pleural effusions > 500 mL in patients receiving mechanical ventilation. Chest. 2005;127(1):224-32.
- Vignon P, Chastagner C, Berkane V, et al. Quantitative assessment of pleural effusion in critically ill patients by means of ultrasonography. Crit Care Med. 2005;33(8):1757-63.
- Qureshi NR, Rahman NM, Gleeson FV. Thoracic ultrasound in the diagnosis of malignant pleural effusion. Thorax. 2009;64(2):139-43.
- Soldati G, Smargiassi A, Inchingolo R, et al. Ultrasound-guided pleural puncture in supine or recumbent lateral position - feasibility study. Multidiscip Respir Med. 2013;8(1):18.
- Mayo PH, Goltz HR, Tafreshi M, et al. Safety of ultrasound-guided thoracentesis in patients receiving mechanical ventilation. Chest. 2004;125(3):1059-62.
- Jenkins JA, Gharahbaghian L, Doniger SJ, et al. Sonographic Identification of Tube Thoracostomy Study (SITTS): confirmation of intrathoracic placement. West J Emerg Med. 2012;13(4):305-11.
- Krejci CS, Trent EJ, Dubinsky T. Thoracic sonography. Respir Care. 2001;46(9):932-9.
- Lichtenstein D, Mezière G, Seitz J. The dynamic air bronchogram. A lung ultrasound sign of alveolar consolidation ruling out atelectasis. Chest. 2009;135(6):1421-5.
- Dorne HL. Differentiation of pulmonary parenchymal consolidation from pleural disease using the sonographic fluid bronchogram. Radiology. 1986;158(1):41-2.
- Targhetta R, Chavagneux R, Bourgeois JM, et al. Sonographic approach to diagnosing pulmonary consolidation. J Ultrasound Med. 1992;11(12):667-72.
- Weinberg B, Diakoumakis EE, Kass EG, et al. The air bronchogram: sonographic demonstrationv. AJR Am J Roentgenol. 1986;147(3):593-5.
- Mathis G. Pneumonia. Thoracic Ultrasound (ERS Monograph), ed. C.B. Laursen, N.M. Rahman, and G. Volpicelli. 2018, Sheffield: European Respiratory Monograph.
- Sperandeo M, Carnevale V, Muscarella S, et al. Clinical application of transthoracic ultrasonography in inpatients with pneumonia. Eur J Clin Invest. 2011;41(1):1-7.
- Reissig A, Kroegel C. Sonographic diagnosis and follow-up of pneumonia: a prospective study. Respiration. 2007;74(5):537-47.
- Reissig A, Heyne JP, Kroegel C. Sonography of lung and pleura in pulmonary embolism: sonomorphologic characterization and comparison with spiral CT scanning. Chest. 2001;120(6):1977-83.
- Reissig A, Kroegel C. Transthoracic ultrasound of lung and pleura in the diagnosis of pulmonary embolism: a novel non-invasive bedside approach. Respiration. 2003;70(5):441-52.
- Squizzato A, Rancan E, Dentali F, et al. Diagnostic accuracy of lung ultrasound for pulmonary embolism: a systematic review and meta-analysis. J Thromb Haemost. 2013;11(7):1269-78.
- Mathis G, Blak W, Reissig A, et al. Thoracic ultrasound for diagnosing pulmonary embolism: a prospective multicenter study of 352 patients. Chest. 2005;128(3):1531-8.
- Stone MB, Secko MA. Bedside ultrasound diagnosis of pulmonary contusion. Pediatr Emerg Care. 2009;25(12):854-5.
- Miller PR, Croce MA, Bee TK, et al. ARDS after pulmonary contusion: accurate measurement of contusion volume identifies high-risk patients. J Trauma. 2001;51(2):223-8; discussion 229-30.
- Arbelot C, Ferrari F, Bouhemad B, et al. Lung ultrasound in acute respiratory distress syndrome and acute lung injury. Curr Opin Crit Care. 2008;14(1):70-4.

