 American College of Emergency Physicians

Staffing to the Arrival Curve: Queueing Theory and Physician Start Times
Shuhan He, MD
An emergency department's waiting room is quiet before dawn, fills through the late morning and stays full into the evening. A schedule of three 8-hour blocks changes its staffing only at 07:00, 15:00 and 23:00. Linda Green and colleagues used a queueing model to rebuild the provider schedule of an urban ED that saw about 25,000 patients a year [1]. The model moved provider hours from the night into the day and started the morning surge coverage sooner. On the four days of the week whose total provider hours did not change, 161 fewer patients left without being seen (LWBS) over 39 weeks. The LWBS rate fell 21.7%, from 9.2% to 7.2%, even though 5.5% more patients arrived.
We simulated a made-up ED to measure how much start times alone change waits and LWBS, and how many physician-hours good timing is worth.
Arrival curves and queueing models
Staffing to the arrival curve takes three steps.
- Count arrivals by hour. Patients arrive at random moments at a rate that changes by hour (a Poisson process), as McCarthy and colleagues found in a year of hourly counts at one academic ED [2]. National data show few arrivals at night, a steep rise from about 08:00 or 09:00, a peak around 12:00 and high volume until late evening [1].
- Multiply each hour's arrivals by the time per patient to get the physicians needed that hour, the same arithmetic that hour-by-hour staffing in urgent care The time per patient, or mean service time, is a physician's own time for one patient, including charting and calls. Green and colleagues estimated 30 minutes, so a fully busy physician starts about 2 new patients an hour [1]. A queueing model adds physicians to keep waits short, treating each hour as a steady state, the long-run average of a queue whose arrival rate never changes (SIPP) [3]. The Erlang-A queue gives each patient a random patience, how long they will wait before leaving [4].
- Let an integer program, an optimization whose answers are whole numbers, place the start times of 8-hour shifts to minimize expected LWBS.
A refinement, lag SIPP, staffs each hour for the arrivals one time per patient earlier, 30 minutes here, because patients who arrive at the peak still need care after it [3,5].
Three ways to place 72 physician-hours
The simulated ED sees 130 patients a day, about 47,000 a year, and its made-up arrival curve has the national shape, from 2.1 arrivals an hour before dawn to 7.9 at midday. The time per patient is 30 minutes [1]. Patience averages about 8 hours, a made-up 12% chance of leaving in each hour of waiting. Patients are seen in order of arrival, and a physician whose shift ends finishes the patient in front of them. Every pattern uses nine 8-hour shifts, or 72 physician-hours a day (Figure 1). Equal blocks put three physicians at 07:00, 15:00 and 23:00. Sized blocks keep those start times with the best split of the nine physicians, three on days, four on evenings and two on nights, found by simulating all 28 splits. Staggered starts may begin on any hour, and the integer program placed them at 06:00, 07:00, 09:00, 11:00, 14:00, 15:00, 17:00, 19:00 and 23:00. We ran 2,000 simulated days for each pattern with the same patients. The model leaves out triage priority, beds, nurses and the way a crowded waiting room itself drives patients away [6].
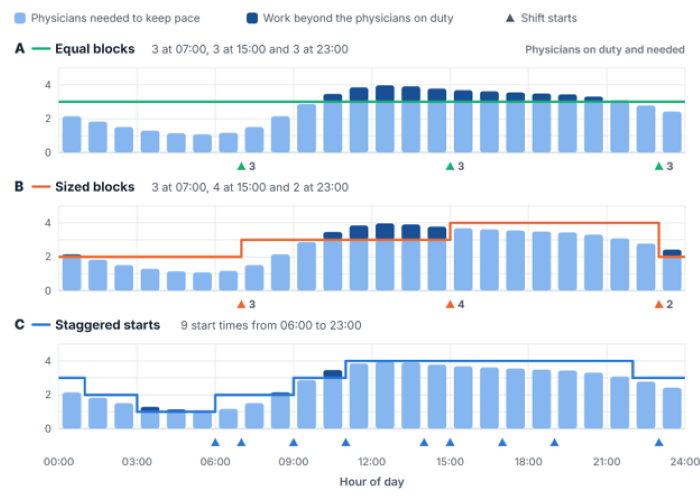
Figure 1. Staggered starts follow the arrival curve that blocks miss. Each panel places the same nine 8-hour shifts (72 physician-hours a day) in a made-up emergency department with 130 arrivals a day. Bars show the physicians needed to keep pace in each hour, the arrival rate one time per patient earlier (the lag, 30 minutes) times the 30-minute time per patient. Dark segments mark work beyond the physicians on duty, for 12 hours a day with equal blocks, 7 with sized blocks and 5 with staggered starts. Lines show physicians on duty and triangles mark shift starts, with a number where more than one shift starts. Sized blocks use the best of the 28 ways to split nine physicians across the 07:00, 15:00 and 23:00 blocks, found by simulating every split on a separate set of 500 simulated days; an integer program placed the staggered starts. Made-up arrival curve.
LWBS and waits by hour of day
Both block patterns have three day physicians, so under both the waiting room filled from late morning to an average of 7.8 patients in the 14:00 hour (Figure 2). Sized blocks then emptied it with four evening physicians, while under equal blocks it stayed full until late evening. Staggered starts added physicians at 09:00 and 11:00 as arrivals climbed, and the waiting room peaked at 3.8 patients. They kept one physician from 03:00 to 06:00, when LWBS among the few patients arriving in the 04:00 hour rose to 10.3%.
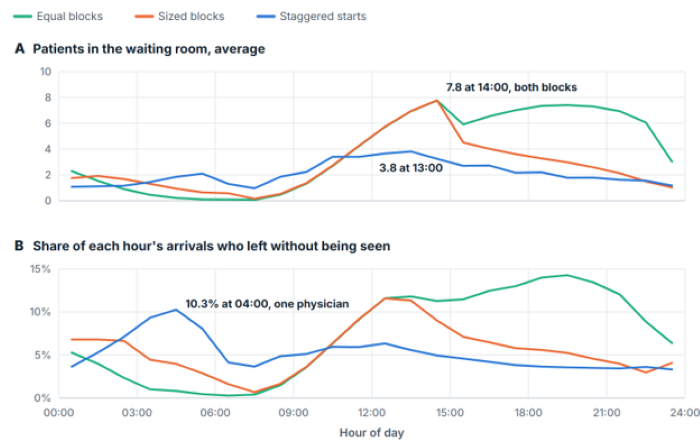
Figure 2. Staggered starts keep the midday waiting room half as full. A, Average number of patients in the waiting room, waiting for a physician, by hour of day. B, Share of the patients arriving in each hour who left without being seen (LWBS). Same made-up emergency department and nine 8-hour shifts as Figure 1; 2,000 simulated days per pattern with the same 260,268 patients. Equal and sized blocks have the same three day physicians, so their lines match from 07:00 to 15:00. With one physician on duty from 03:00 to 06:00, staggered starts let LWBS rise before dawn, to 10.3% of patients arriving at 04:00, and held it at 6.3% or less from 07:00 to 01:00. Simulation.
LWBS fell from 8.9% with equal blocks to 6.1% with sized blocks and 4.9% with staggered starts (Figure 3). With a floor of two physicians every hour, staggered starts gave 5.1%, still 16% below sized blocks. Staggered starts lowered LWBS by 21% compared with sized blocks, or about 600 fewer patients a year, and by 45% compared with equal blocks. These levels depend on the made-up volume and patience and run higher than the 2.6% median across 262 California EDs [7], so the relative changes matter more than the levels. In an ED with less LWBS, the same 21% would mean fewer than 600 patients a year. Only staggered starts met Green and colleagues' target of no more than 20% of patients waiting over an hour [1], with 16% not seen within an hour, against 23% with sized blocks and 36% with equal blocks.
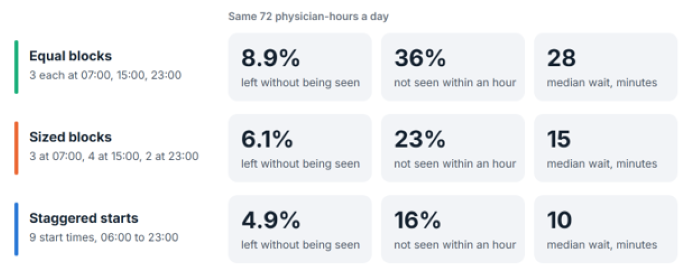
Figure 3. With the same physician-hours, staggered starts had the lowest LWBS and the shortest waits. Patients who left without being seen (LWBS); patients not seen by a physician within an hour of arrival, counting those who left; and the median wait for a physician among patients seen. Same three patterns as Figures 1 and 2; 2,000 simulated days and 260,268 patients per pattern. 95% intervals (batch means, 40 batches of 50 days) are within 0.2 percentage points for LWBS, 1.0 percentage points for the share not seen within an hour and 1.2 minutes for the median wait. Simulation.
What hourly queueing formulas miss
Planning without the lag gave essentially the same LWBS, 4.8% against 4.9%, because the lag matters most when the time per patient runs long [5]. The hourly formulas also treat each hour on its own. Asked to fill the three blocks, the integer program chose four, three and two physicians; simulation ranked that split third of the 28, because three evening physicians left a full waiting room for two night physicians. Moving any single staggered start by an hour lowered LWBS by at most 0.1 percentage points, so the placement was close to the best.
Physician-hours saved at equal LWBS
Staggered starts reached the 6.1% LWBS of sized blocks with about 3.3 fewer physician-hours a day, interpolating between 64 and 72 hours (Figure 4). Sized blocks needed about 3.9 more hours a day to match staggered starts. Staggered starts matched the 8.9% of equal blocks with about 9.3 fewer hours. With 48 hours, time for about 96 of the 130 daily patients, staggered starts were 0.6 points below sized blocks, while equal blocks were 2.7 points worse than sized blocks. At 48 hours, the split across blocks mattered more than fine timing. The gap between staggered starts and sized blocks was largest, 1.4 points, at 64 hours, time for about 128 patients. In five general hospital EDs, Sinreich and Jabali's staggered schedules cut physician hours by 8% to 17.5% with simulated length of stay between 19% shorter and 4% longer [8].
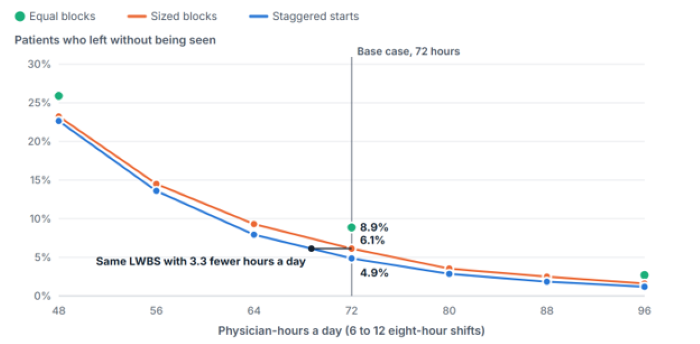
Figure 4. Staggered starts reach the same LWBS with about 3 fewer physician-hours a day. Patients who left without being seen (LWBS) by physician-hours a day, from 6 to 12 eight-hour shifts. Sized blocks use the best split for each total, found by simulation; the integer program placed the staggered starts; equal blocks appear where the shifts divide evenly across the three blocks. The horizontal line marks the LWBS of sized blocks at 72 hours (6.1%), which staggered starts reach at about 68.7 hours by linear interpolation. Sized blocks would need about 75.9 hours to reach the 4.9% of staggered starts, and staggered starts reach the 8.9% of equal blocks at about 62.7 hours, 9.3 fewer than 72. 2,000 simulated days per point; every 95% interval is within 0.4 percentage points. Simulation.
Patience, pace and the shape of the curve
We varied the made-up patience and arrival curve and the estimated time per patient (Figure 5). Staggered starts lowered LWBS in all nine cases, by 11% to 36% compared with sized blocks. The gain was smallest with a flatter arrival curve, which leaves less to match, and with a 36-minute time per patient, which leaves physicians short for much of the day. In three community EDs, Joseph and colleagues found that attending physicians saw 2.2 to 3.0 new patients in the first hour of a shift and significantly fewer after it [9]. When pace fell over the shift in those proportions, staggered starts lowered LWBS by 36%. Joseph and colleagues concluded that shifts should start near times of high volume and be staggered [9].
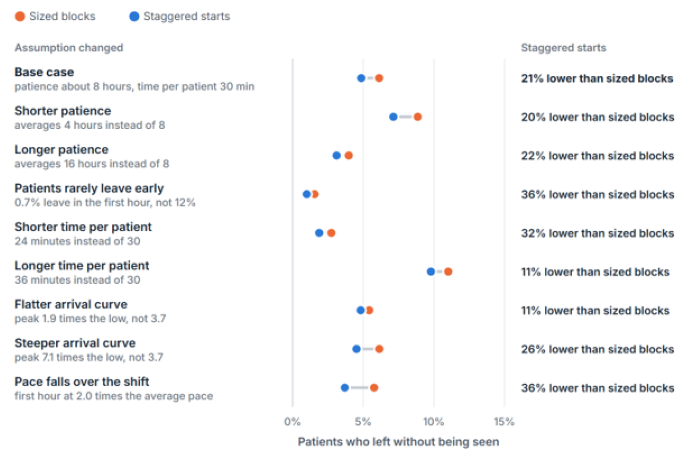
Figure 5. Staggered starts lowered LWBS under every assumption we varied. Patients who left without being seen (LWBS) with sized blocks and with staggered starts at 72 physician-hours a day. The base case has patience averaging about 8 hours (a 12% chance of leaving in each hour of waiting), a 30-minute time per patient and peak arrivals 3.7 times the overnight low. Each other row changes one assumption, as its second line states. For patients who rarely leave early, patience keeps the 8-hour average but follows a gamma distribution with shape 3. Flatter and steeper curves raise each hour's share to the power 0.5 or 1.5 and keep the daily total. In the pace row, physicians start new patients at a pace that falls over the shift in the proportions Joseph and colleagues measured, with the base schedules; every other row re-chooses the block split by simulation and re-solves the staggered starts. 2,000 simulated days per point. Simulation.
What an informatics team can do now
- Pull a year of arrival times from the ED tracking system and average them by hour, separately for weekdays and weekends, as Green and colleagues did [1].
- Estimate the time per patient from EHR timestamps in busy hours.
- Multiply each hour's arrivals by the time per patient and compare the result with the physicians on duty in a coverage planner that shows the shortfall by hour.
- Let an integer program place start times within the group's rules on shift length and overnight minimums, then test the schedule in a simulation. Staggered starts make short gaps between shifts easier to create, so check each new start time for at least 11 hours of rest and a full night in bed after a night shift (Part 3 of this series). Staggered starts can enter the schedule as swing and mid shifts.
- Track LWBS and the share of patients not seen within an hour, by hour of arrival, for several months before and after the change.
The bottom line
In our simulated ED, start times that followed the arrival curve lowered LWBS by 21% compared with sized blocks and by 45% compared with equal blocks, with the same 72 physician-hours. With a floor of two physicians every hour, the reduction against sized blocks was 16%. Matching the curve was worth about 3 to 4 physician-hours a day against sized blocks and about 9 against equal blocks. Hourly queueing formulas placed the staggered starts well, and the simulation caught a block split they got wrong.
Join the discussion on EngagED
Has your group moved shift start times to follow its arrivals? Tell the Emergency Medicine Informatics Section what happened to LWBS and waits on EngagED.
References
- Green LV, Soares J, Giglio JF, Green RA. Using queueing theory to increase the effectiveness of emergency department provider staffing. Acad Emerg Med. 2006;13(1):61-68. doi:10.1197/j.aem.2005.07.034
- McCarthy ML, Zeger SL, Ding R, Aronsky D, Hoot NR, Kelen GD. The challenge of predicting demand for emergency department services. Acad Emerg Med. 2008;15(4):337-346. doi:10.1111/j.1553-2712.2008.00083.x
- Green LV, Kolesar PJ, Soares J. Improving the SIPP approach for staffing service systems that have cyclic demands. Oper Res. 2001;49(4):549-564. doi:10.1287/opre.49.4.549.11228
- Garnett O, Mandelbaum A, Reiman M. Designing a call center with impatient customers. Manuf Serv Oper Manag. 2002;4(3):208-227. doi:10.1287/msom.4.3.208.7753
- Green LV, Kolesar PJ, Whitt W. Coping with time-varying demand when setting staffing requirements for a service system. Prod Oper Manag. 2007;16(1):13-39. doi:10.1111/j.1937-5956.2007.tb00164.x
- Batt RJ, Terwiesch C. Waiting patiently: an empirical study of queue abandonment in an emergency department. Manage Sci. 2015;61(1):39-59. doi:10.1287/mnsc.2014.2058
- Hsia RY, Asch SM, Weiss RE, et al. Hospital determinants of emergency department left without being seen rates. Ann Emerg Med. 2011;58(1):24-32.e3. doi:10.1016/j.annemergmed.2011.01.009
- Sinreich D, Jabali O. Staggered work shifts: a way to downsize and restructure an emergency department workforce yet maintain current operational performance. Health Care Manag Sci. 2007;10(3):293-308. doi:10.1007/s10729-007-9021-z
- Joseph JW, Davis S, Wilker EH, et al. Modelling attending physician productivity in the emergency department: a multicentre study. Emerg Med J. 2018;35(5):317-322. doi:10.1136/emermed-2017-207194
Shuhan He, MD, is chair of the ACEP Emergency Medicine Informatics Sectio