Cardiac
Michael I. Prats, MD, FACEP and David P. Bahner, MD, FACEP
I. Introduction and Indications
- Cardiac ultrasound can be used to quickly diagnose many serious and potentially life-threatening pathologies.
- It is reasonable to perform a focused cardiac ultrasound on any critically ill patient to help with diagnosis and guide management.
- Specific indications include:1,2
- Trauma
- Hypotension
- Concern for right heart strain in suspected pulmonary embolism
- Concern for acute heart failure
- Syncope
- Cardiac arrest
- Chest pain or dyspnea
- Assessment of volume responsiveness
- Emergency ultrasound potentially improves survival in penetrating cardiac injury,3 can accurately calculate systolic function,4 identify pericardial effusions,5 diagnosis acute heart failure,6 diagnose right heart strain,7 predict fluid responsiveness,8 and predict short-term outcomes in cardiac arrest.9 Competency in many of these areas does not take advanced training.10
II. Anatomy
- Normally the heart sits in the left thorax with the apex pointing inferiorly and approximately 60 degrees to the left.
- The point of maximal impulse may be palpated on the chest to estimate the patient’s cardiac apex.
- Each patient may have different orientation of their cardiac structure and transducer position may need to be adjusted accordingly.
- This is especially common in patients with pathologies such as cardiomegaly or chronic lung disease.
- Echocardiography is a dynamic assessment and the structures must be examined through the entire cardiac cycle.
- The valves can be used to determine cardiac cycle in a patient in normal sinus rhythm.
- Atrio-ventricular valves (mitral and tricuspid) are open during diastole and closed during systole.
- The aortic and pulmonic valves are open during systole and closed during diastole.
- The thinner walled right and left atria sit superior to the thicker walled right and left ventricles.
- Blood enters the heart through the inferior and superior vena cava in the right atrium. It then passes through the tricuspid valve into the right ventricle, through the pulmonic valve into the pulmonary arteries. After flowing through the pulmonary circulation, blood returns to the left atrium via four pulmonary veins, then passes through the mitral valve into the left ventricle, and exits the heart through the aortic valve into the ascending aorta.
- There are distinctions between the normal left and right ventricles:
- The left ventricle is larger with thicker walls and a rounded apex. Contraction is torsional, towards the apex.
- The right ventricle is more tapered toward the apex. Contraction is more linear, towards the apex.
- The cardiac anatomy appears differently depending on the plane of imaging.
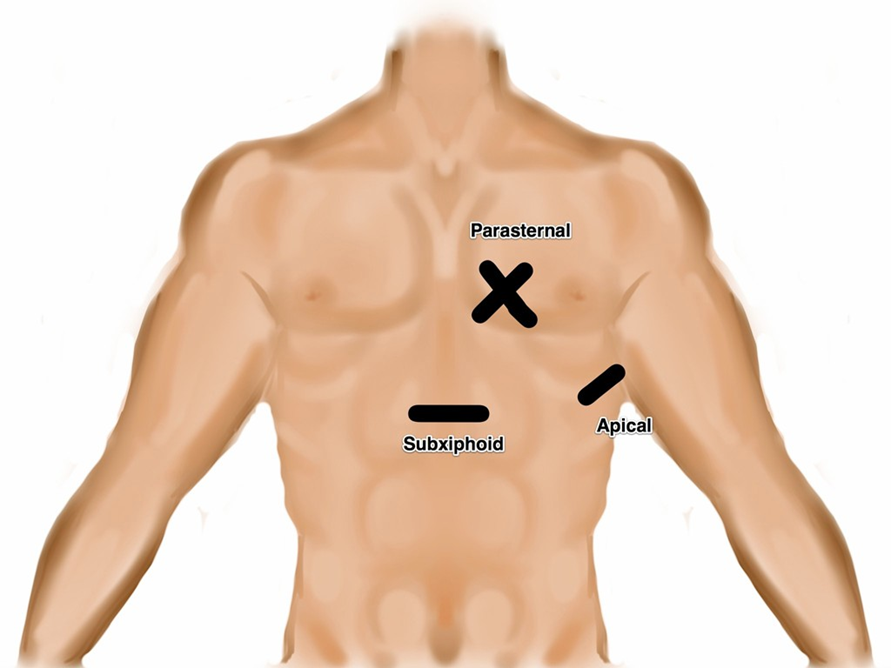
- Illustration 1. Transducer location for the four focused cardiac views
- Subxiphoid or Subcostal View: The liver is used as an acoustic window and is seen at the left of the screen and near field. The right ventricle being the most anterior is adjacent to the liver. The apex will be to the right of the screen. By fanning inferiorly, the inferior vena cava (IVC) is seen in short axis. Often the hepatic veins can be seen in the liver draining into the IVC.
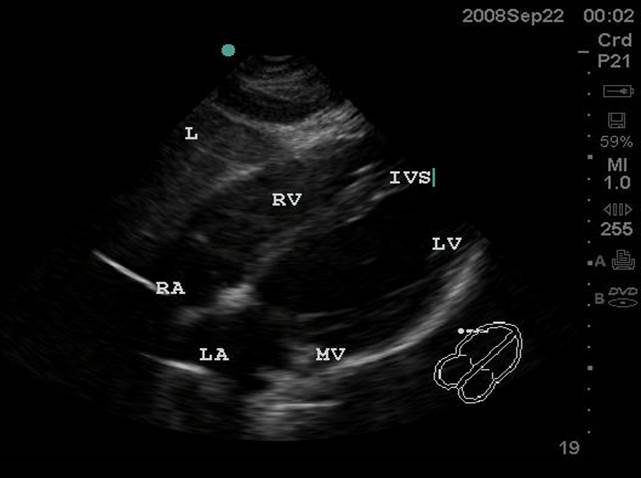
- Figure 1. Subxiphoid View. RA = Right atrium. RV = Right ventricle. IVS = interventricular septum. LV = left ventricle. MV = Mitral valve. LA = left atrium. L = Liver
Video 1. Normal Subxiphoid View - Parasternal Long Axis View: This view captures the flow of blood through the left side of the heart. The apex is to the left of the screen. The mitral valve leaflets are seen and often chordae tendinae connecting them to papillary muscles. Two cusps of the aortic valve (usually the non-coronary and right coronary cusp) are seen. The left ventricular outflow tract (LVOT) is the term for the aortic root and proximal ascending aorta. A portion of the right ventricle is seen in the near field.
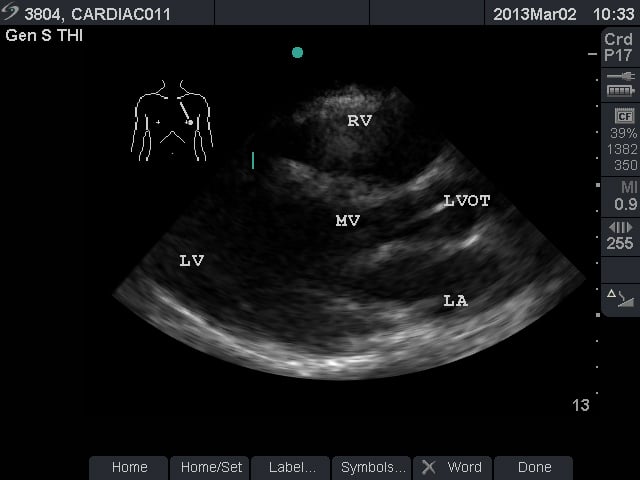
- Figure 2. Parasternal long axis view. RV = Right ventricle. LV = left ventricle. MV = mitral valve. LVOT = left ventricular outflow tract. LA = left atrium
Video 2. Normal parasternal long axis view - Parasternal Short Axis View: This view is a cross sectional view of the left and right sides of the heart. These can be “sliced” at various levels between the base and the apex. By fanning the probe towards the right shoulder, one can visualize the aortic valve in cross section. The “Mercedes Benz” sign shows all three of the leaflets. The right ventricular outflow tract and pulmonary valve can be seen in this view. At the base, the mitral valve is seen inside the left ventricle. At the mid ventricular level, the papillary muscles are seen within the left ventricle. This is the most commonly used parasternal short axis view in point-of-care ultrasound in the acute care setting. At the apex, the left ventricle has tapered and no structures are seen within.
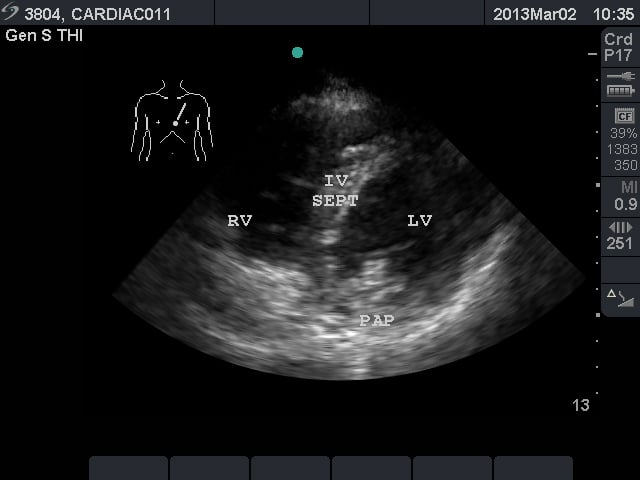
- Figure 3. Parasternal short axis view at the mid ventricular level. RV = right ventricle. IV SEPT = interventricular septum
- Video 3. Normal Parasternal short axis view at the mid ventricular level
- Apical Four Chamber View: This view shows all four chambers of the heart. The apex is toward the near field with the interventricular septum pointing to approximately the 12 o’clock position. By fanning superiorly, the apical five chamber view can be obtained, with the “fifth chamber” being the LVOT with the aortic valve.
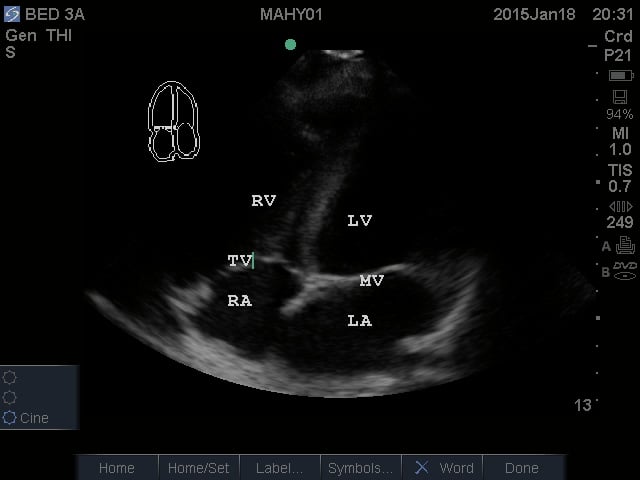
- Figure 4. Apical Four Chamber view. RV = Right ventricle. LV = Left ventricle. TV = Tricuspid valve. RA = Right atrium. LA = Left atrium. MV = Mitral valve
Video 4. Normal Apical Four Chamber View
- Subxiphoid or Subcostal View: The liver is used as an acoustic window and is seen at the left of the screen and near field. The right ventricle being the most anterior is adjacent to the liver. The apex will be to the right of the screen. By fanning inferiorly, the inferior vena cava (IVC) is seen in short axis. Often the hepatic veins can be seen in the liver draining into the IVC.
III. Scanning Technique, Normal Findings and Common Variants
Scanning Technique
- Following the I-AIM model,11 once the indication has been recognized, acquisition of images can take place. This involves optimizing the probe, patient, and picture.
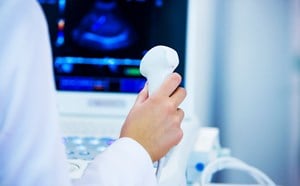
- To visualize the heart between ribs, transducers with smaller footprints and low frequencies (2-4 MHz) are ideal. The phased or microconvex arrays are commonly used.
- The curvilinear transducer can also be used and may be preferred for the subxiphoid view; however, rib shadows may limit adequate views on the chest.
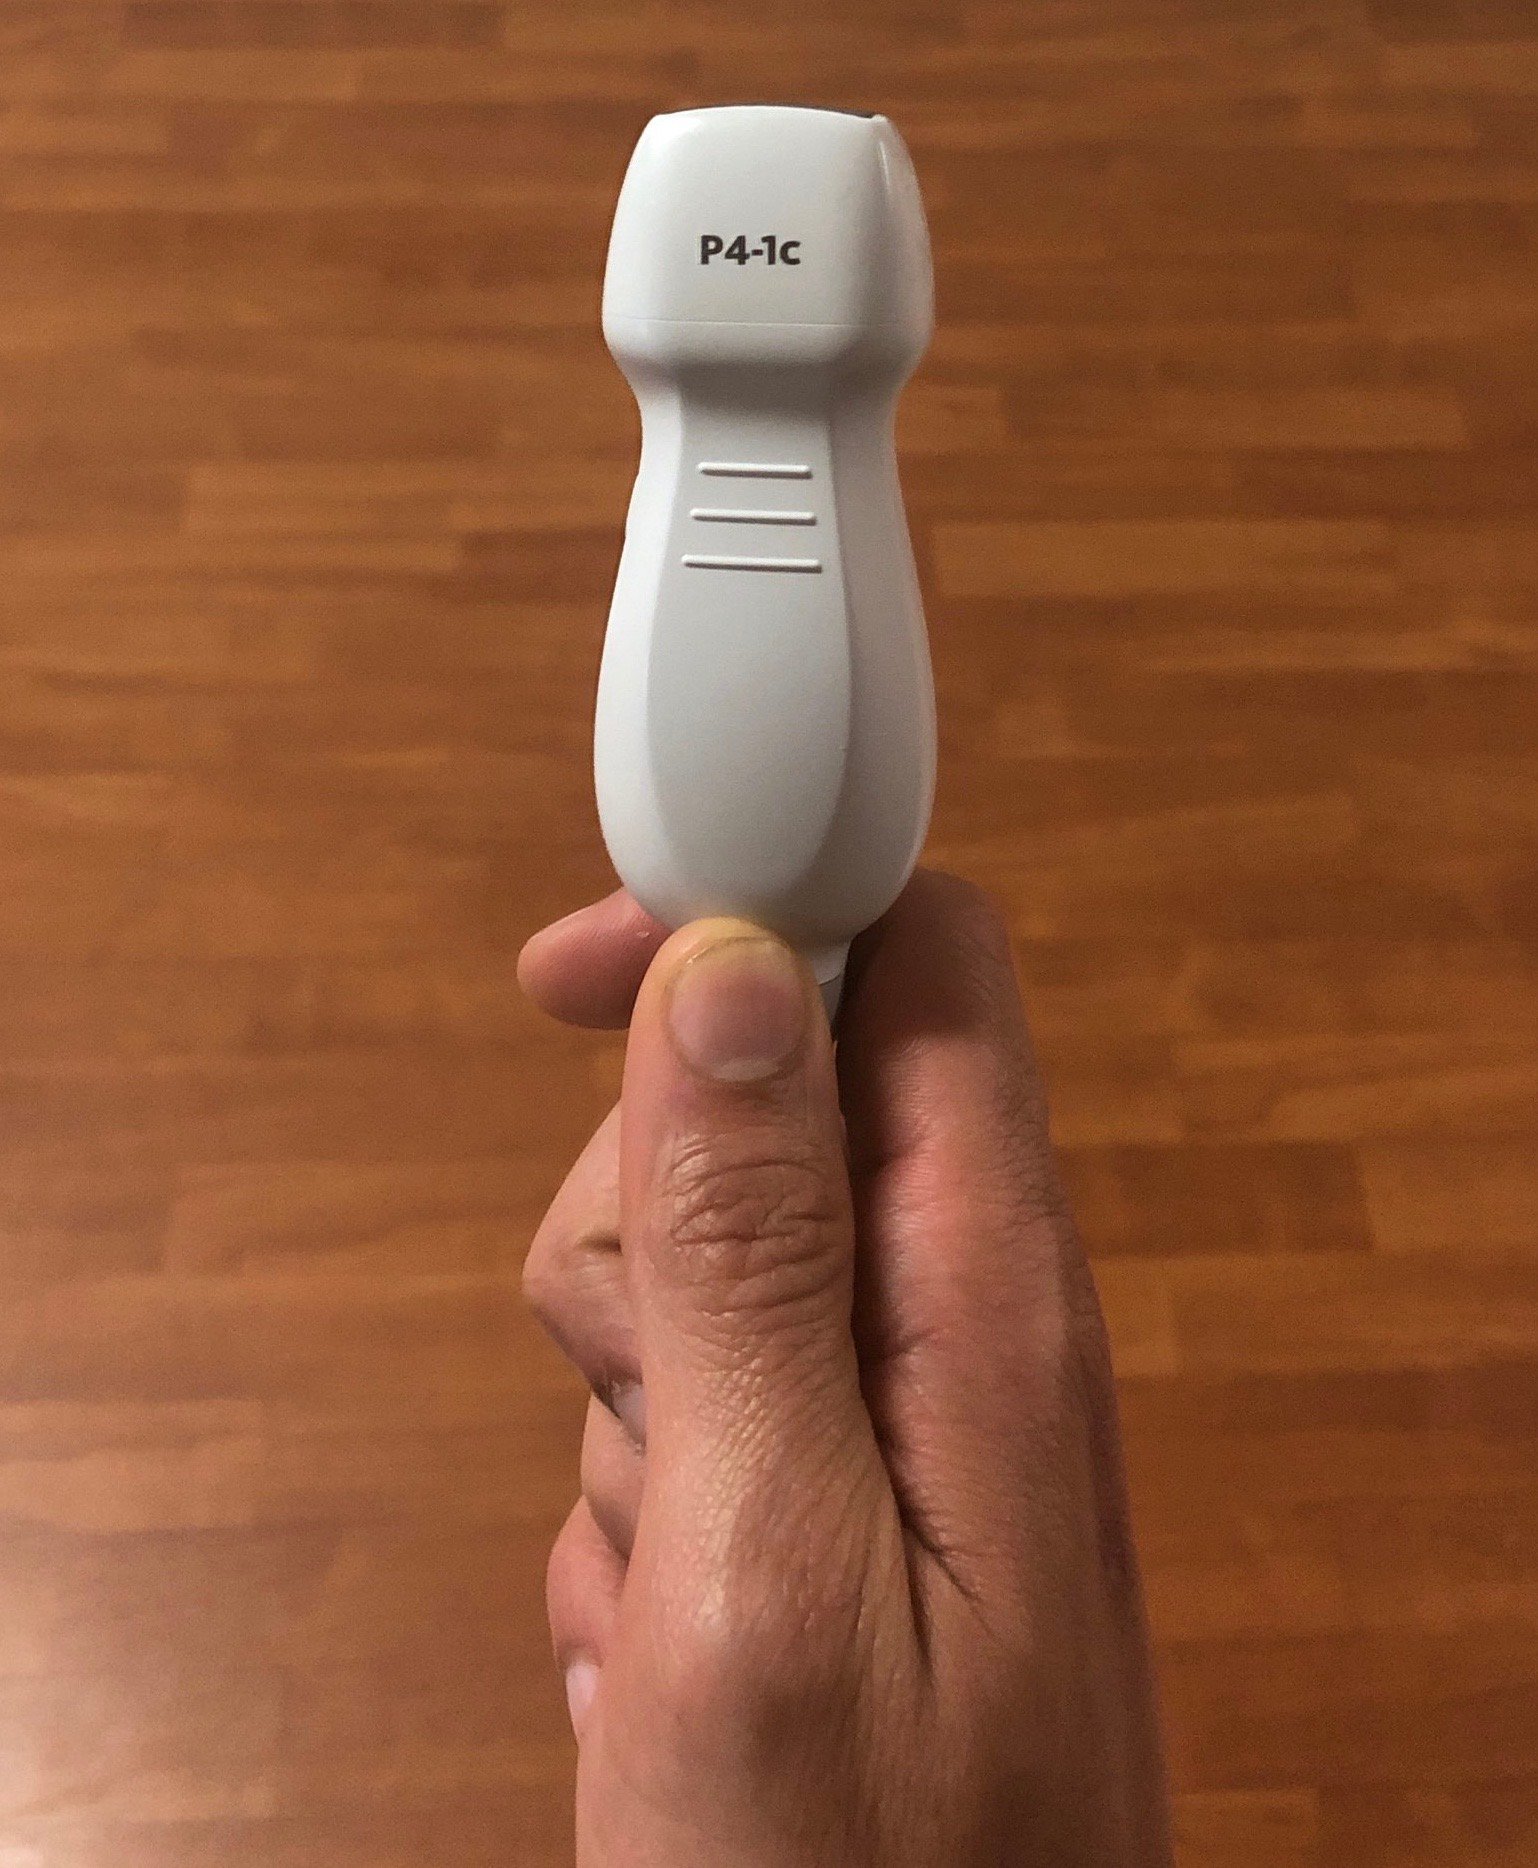
- Figure 5. Phased array probe
- The curvilinear transducer can also be used and may be preferred for the subxiphoid view; however, rib shadows may limit adequate views on the chest.
- There are two accepted conventions for probe position indicator which are 180 degrees of each other.12 Emergency physicians tend to favor the indicator on the left side of the screen as this is the convention for other forms of ultrasonography. Cardiology and other specialties will often have the indicator on the right side of the screen. Importantly, both techniques result in identical images. The instructions below are assuming screen indicator is on the left side of the screen.
- The patient can be supine or semi-upright. Left lateral decubitus can assist in obtaining parasternal and apical views. The supine position may allow better subcostal visualization.
- In all cases, video clips are preferable to still images. Attempt to obtain all four focused cardiac views or corroborate findings.
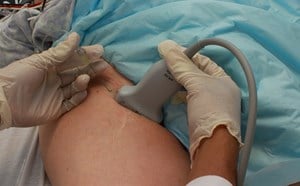
- Obtain subxiphoid view. Palpate xiphoid process, place probe inferior with the indicator to the patient's right. Initially orient slightly to the right shoulder to visualize liver as acoustic window. Rock toward left shoulder until heart is visualized. Deep inspiration of the patient may improve visualization
- Figure 6. Probe position for acquisition of subxiphoid view
- Fan inferiorly to visualize the IVC in short axis. Rotate the transducer 180 degrees clockwise to visualize IVC in long axis. Note overall diameter and collapsibility with respirations approximately 2-3 cm distal from the right atria or just distal to the insertion of the hepatic vein.
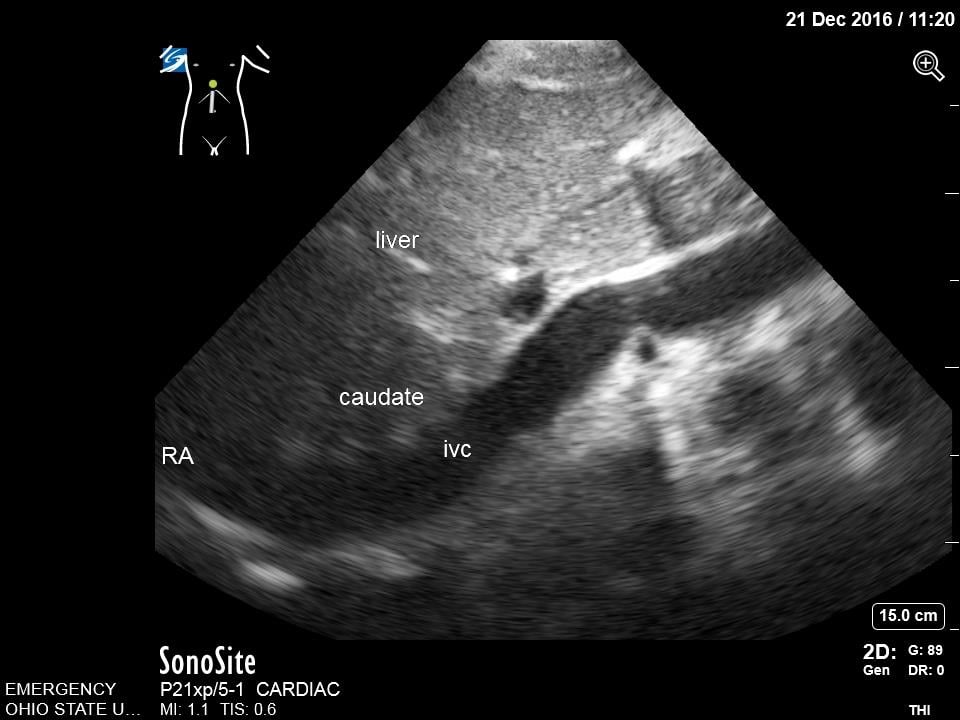
- Figure 7. Subcostal Inferior Vena Cava in Long Axis. IVC = inferior vena cava. Caudate = caudate lobe of the liver. RA = right atrium
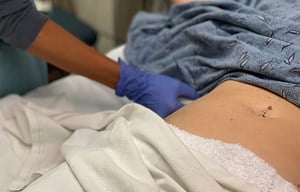
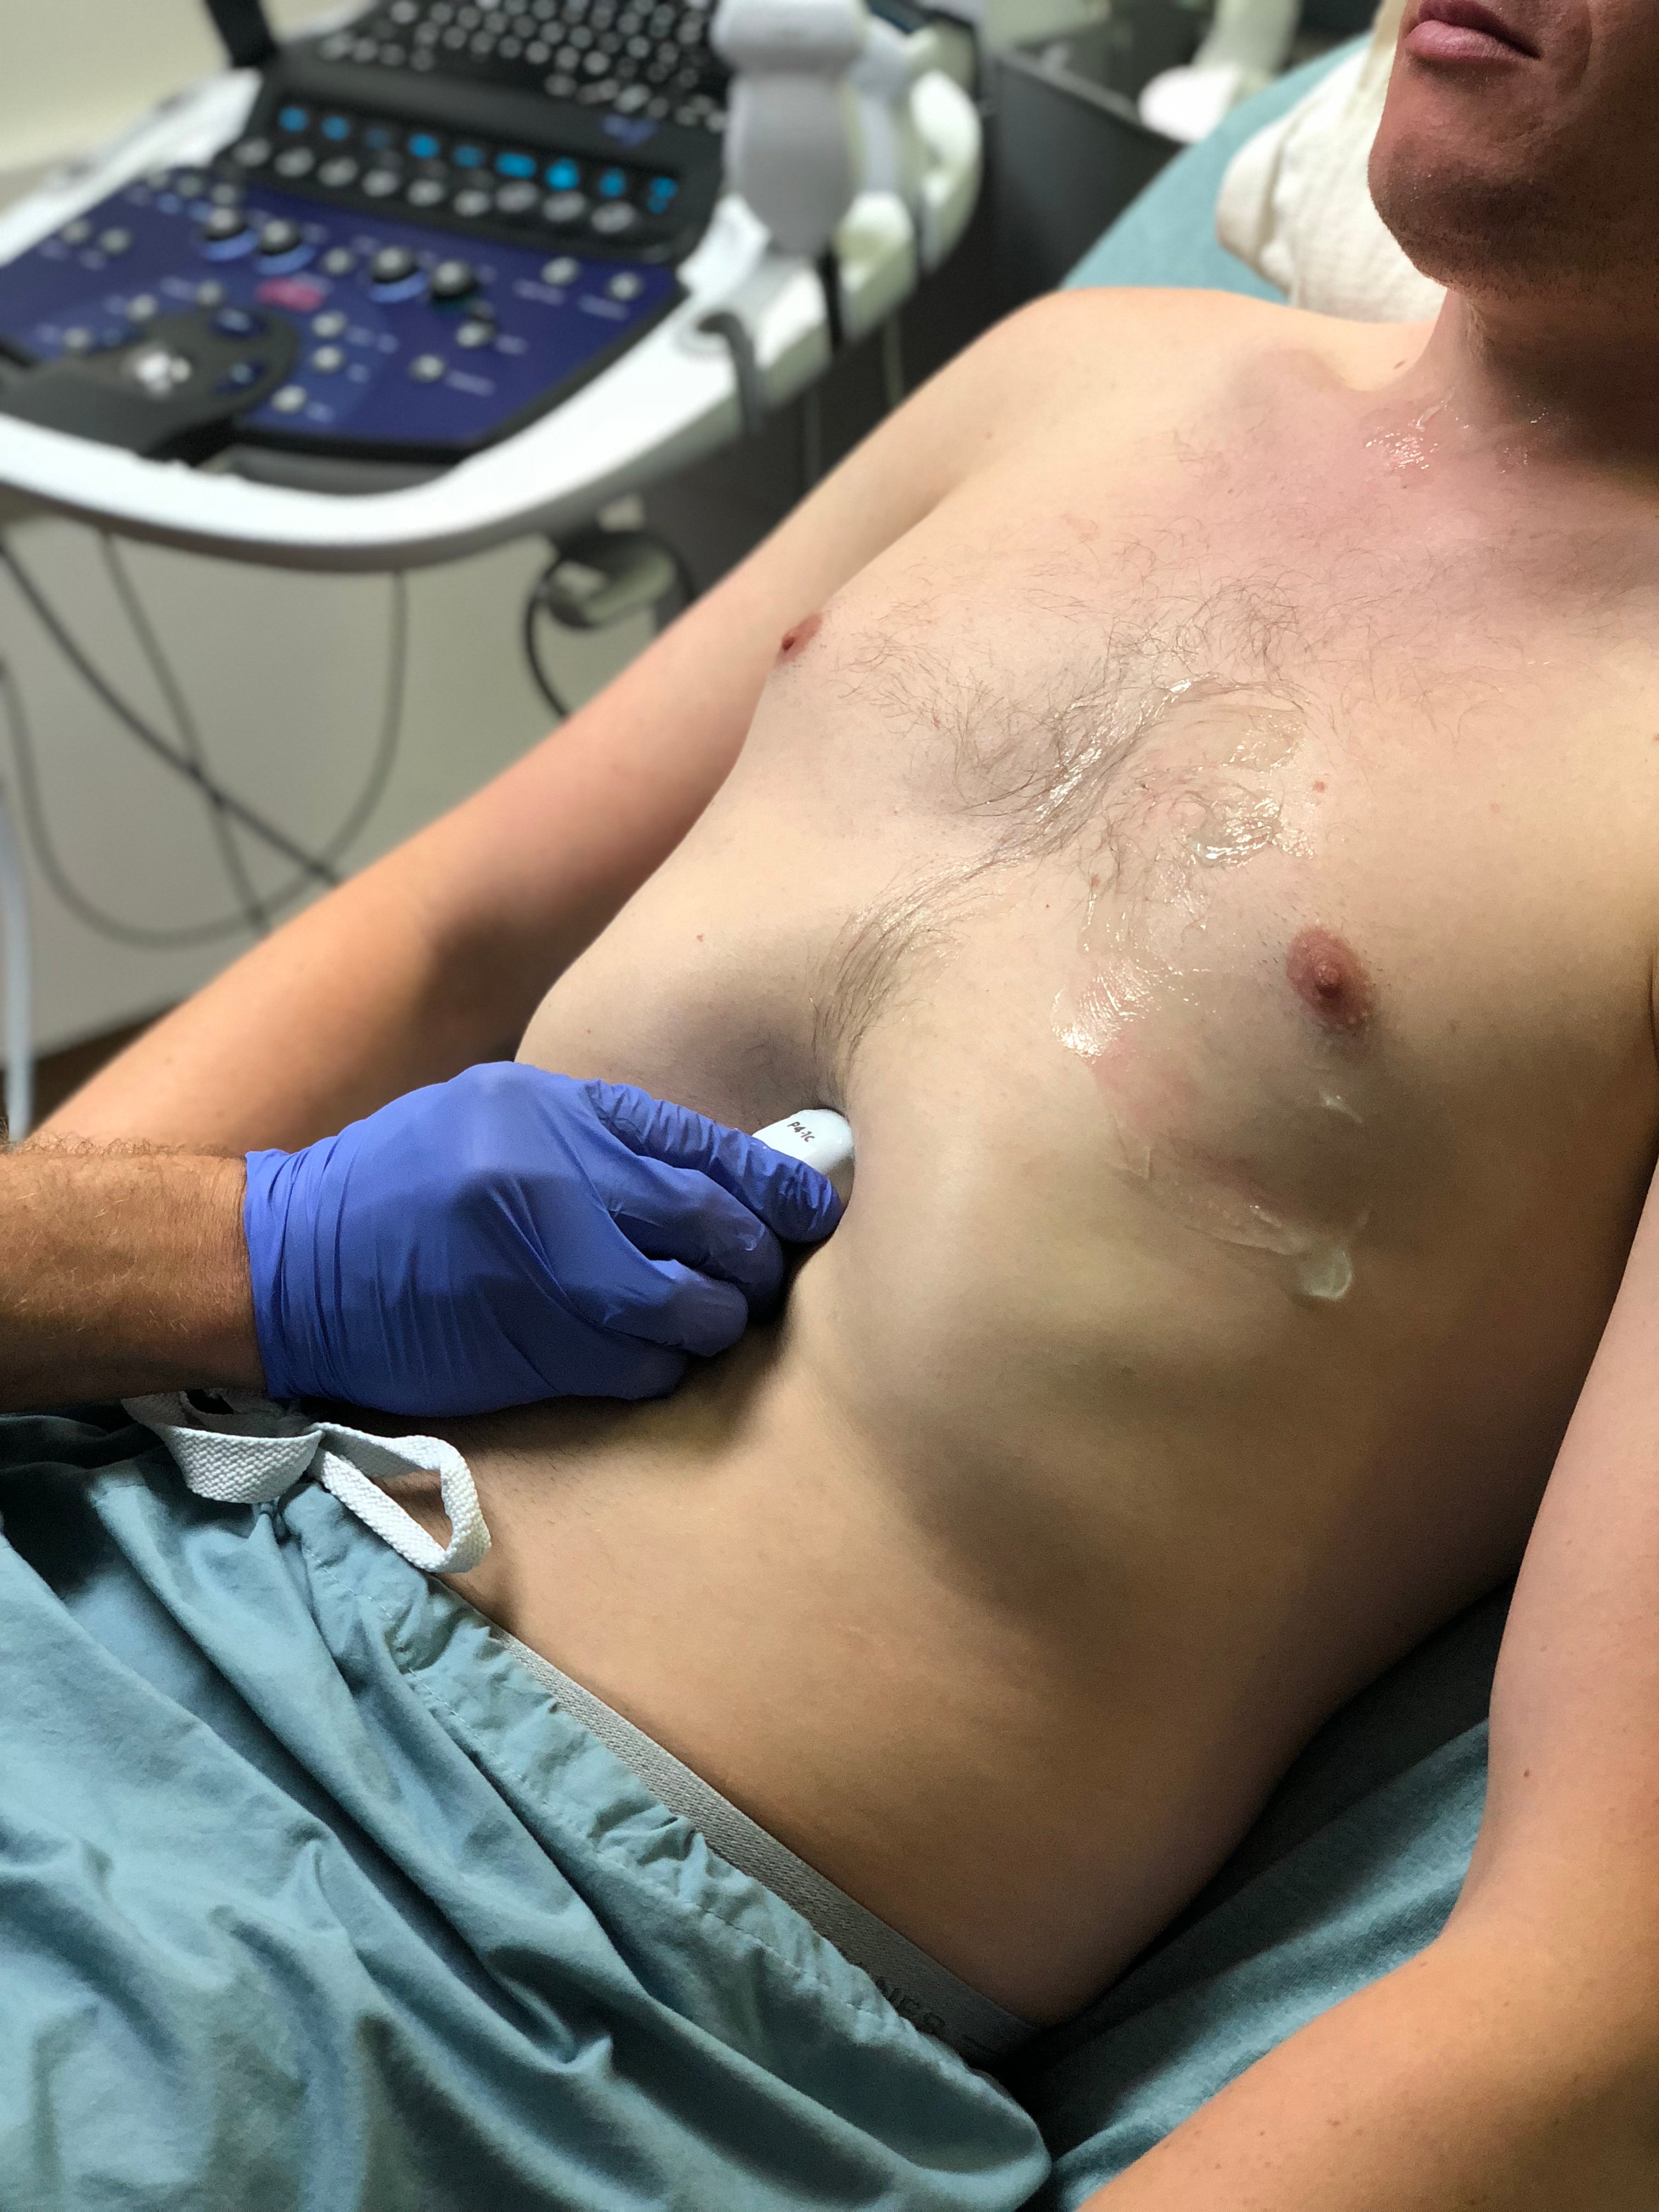
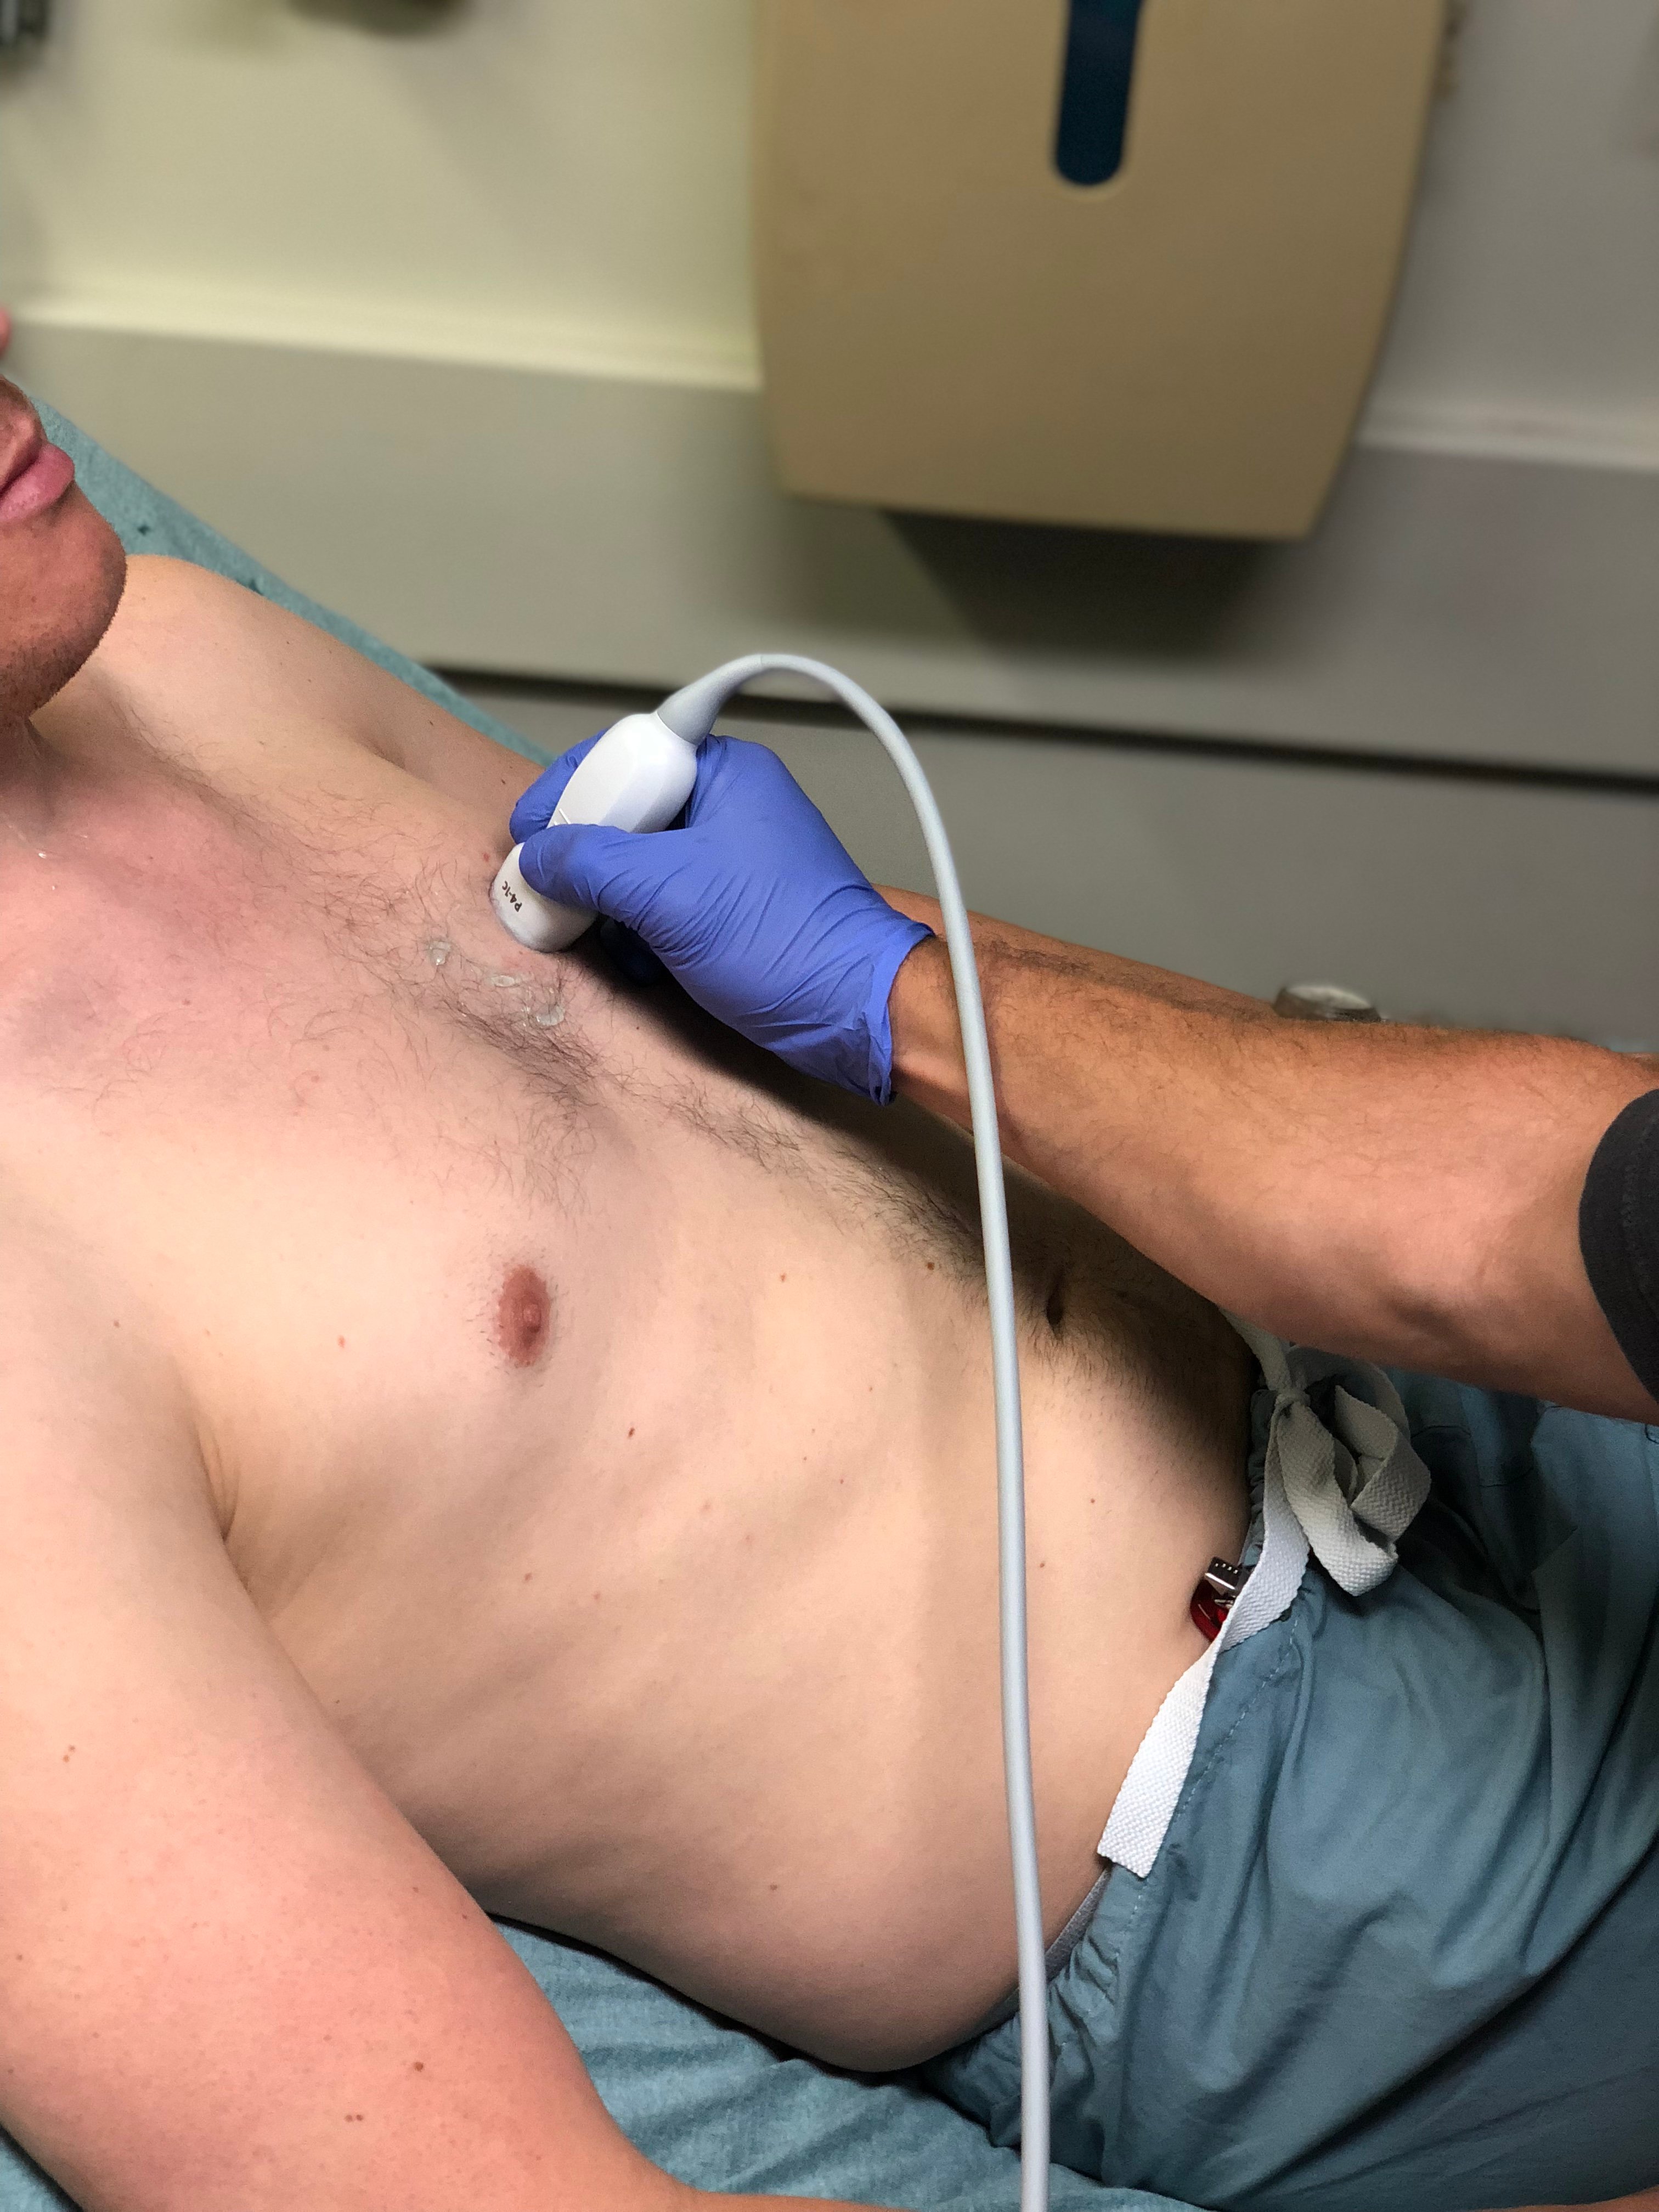
- Obtain parasternal long axis view. The indicator should point to the patient's left hip initially, but then the position can be modified to best visualize the aortic valve, mitral valve, and cardiac apex. The transducer is moved in large circular motions on the left anterior chest to determine the patient’s optimal window. This is generally in the third or fourth intercostal space.
- Figure 8. Probe position for acquisition of parasternal long axis view
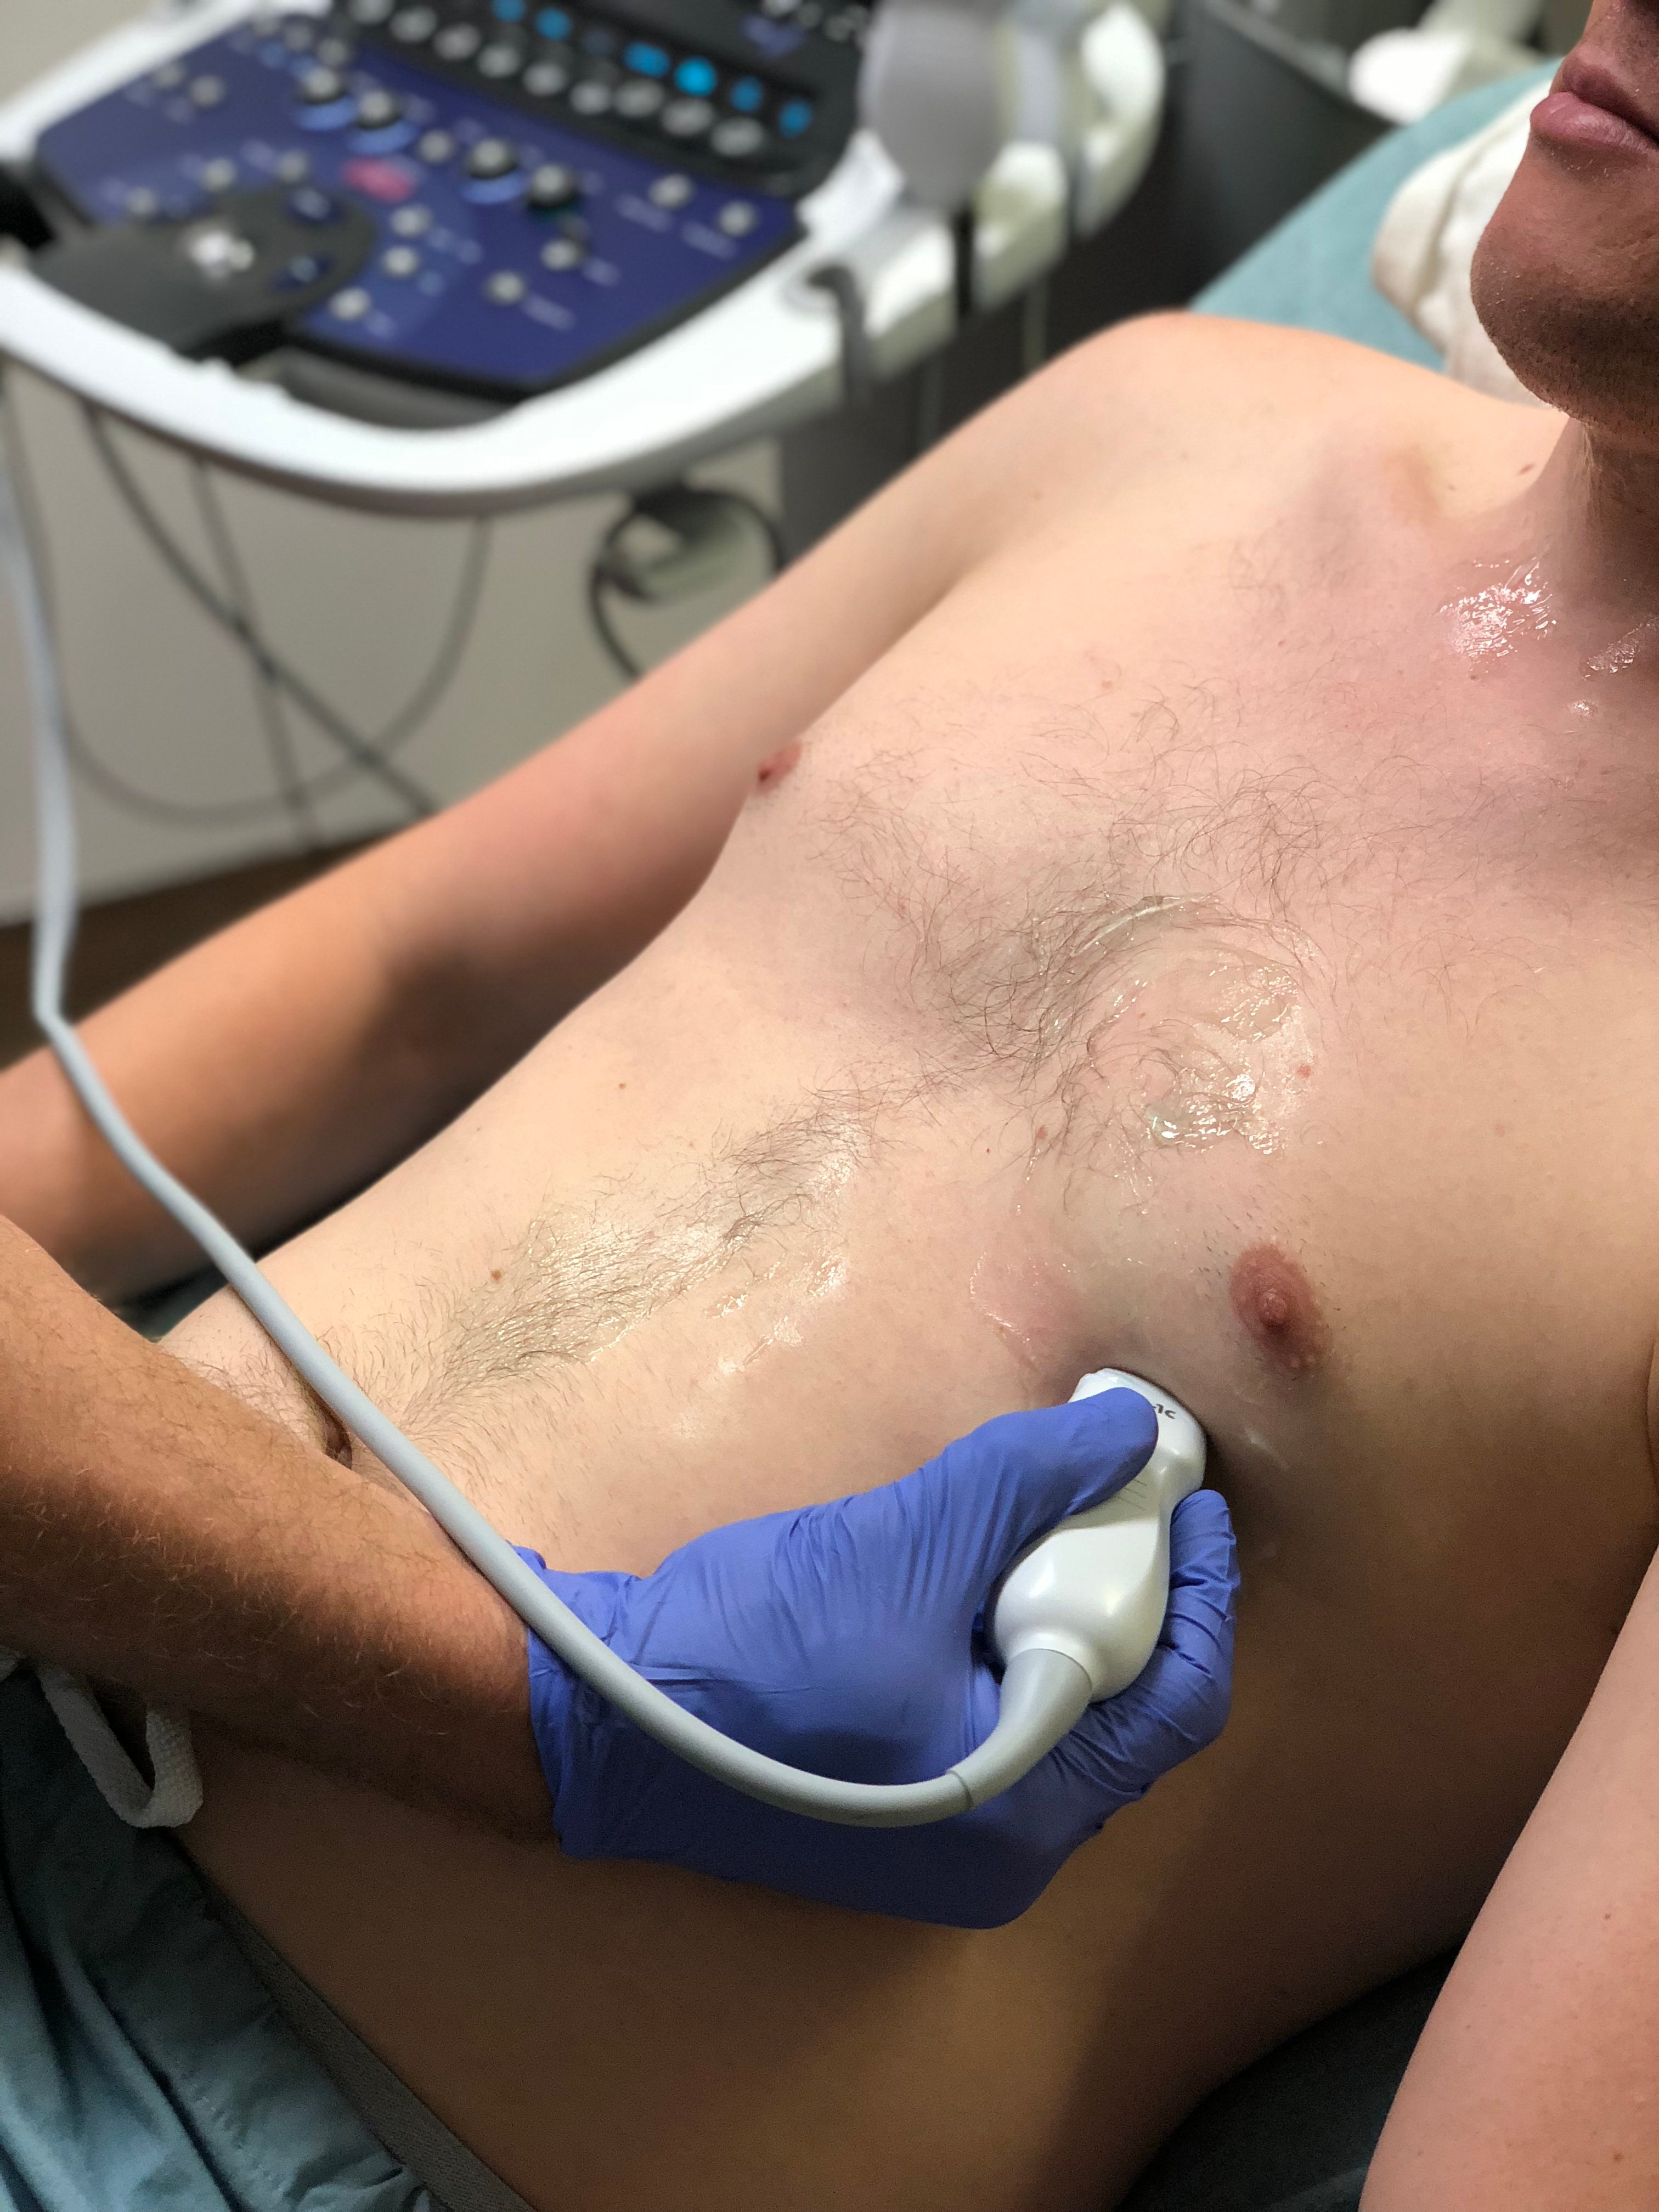
- Obtain parasternal short axis. From the parasternal long axis, rotate the transducer 90 degrees clockwise such that the indicator now points to the right hip. Fan through the aortic valve, left ventricle base, mid, and apex.
- Figure 9. Probe position for acquisition of parasternal short axis view
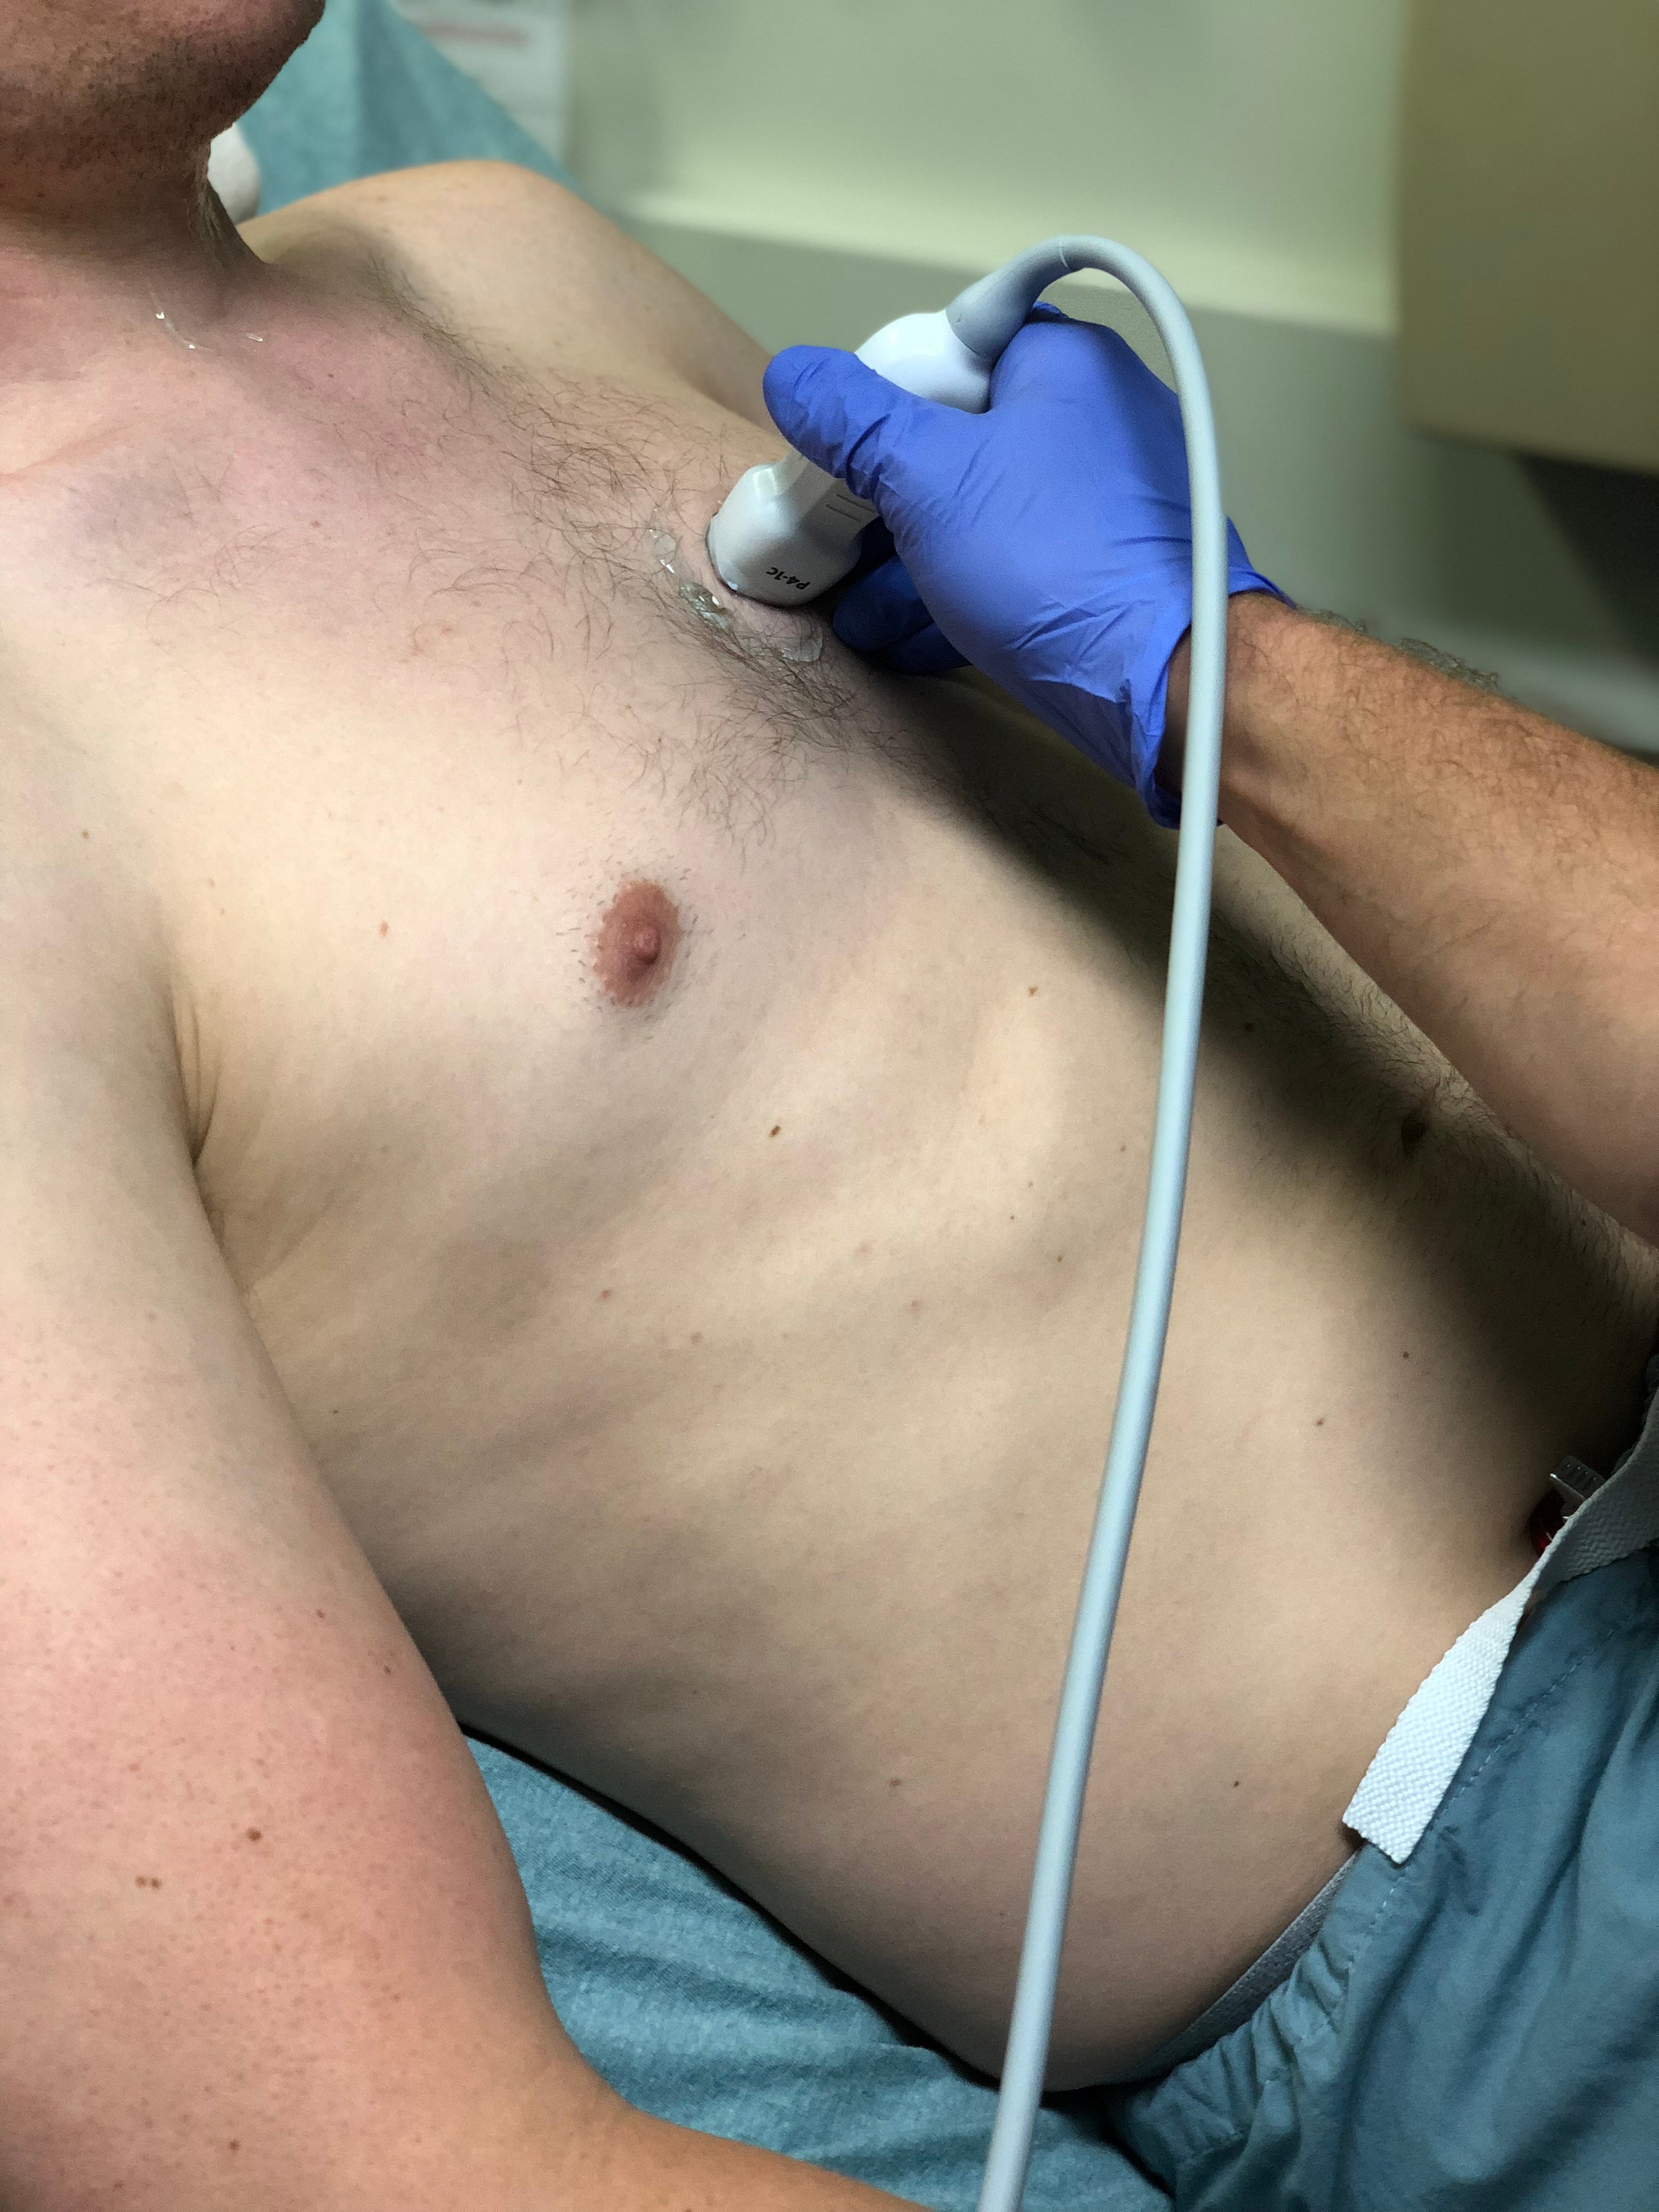
- Obtain apical four chamber view. Palpate the point of maximal impulse. Place the transducer, with indicator pointed to patient’s right side, over this point, which is generally at the inframammary fold or under the left breast in women. Slide and rock the probe to ensure the interventricular septum is at approximately the 12 o’clock position. You can then fan superiorly to visualize the LVOT in the apical 5 chamber view.
- Figure 10. Probe position for acquisition of apical four chamber view
- Obtain subxiphoid view. Palpate xiphoid process, place probe inferior with the indicator to the patient's right. Initially orient slightly to the right shoulder to visualize liver as acoustic window. Rock toward left shoulder until heart is visualized. Deep inspiration of the patient may improve visualization
E-point Septal Separation
This is a technique that is commonly employed to provide an objective measurement of systolic function of the left ventricle. Using M-mode, capture the distance between the anterior leaflet of the mitral valve and the interventricular septum. A measure >7mm correlates with reduced cardiac function.13 This measurement may not be accurate in cases of aortic regurgitation, mitral stenosis, hypertrophic cardiomyopathy, and non-sinus rhythm.
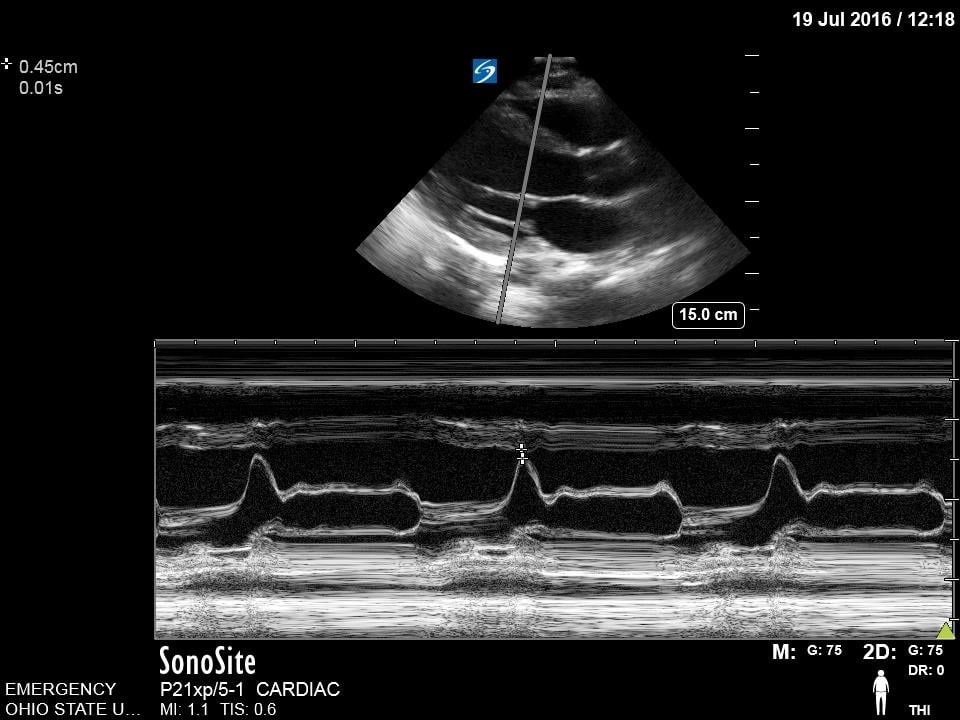
Figure 11. Normal E-point septal separation
IVC Measurements
The IVC can be used as a measure of volume responsiveness, although this is more accurate in mechanically ventilated patients than in those spontaneously breathing.8,14,15 This is likely most helpful in the extremes. A patient with a small IVC that is highly collapsible would likely benefit from fluids. M-mode can be used to measure inspiratory and expiratory diameters although caution must be taken to prevent measuring the IVC at inconsistent points due to overall movement from breathing. A patient with a large IVC that has no change in diameter with respirations, is less likely to benefit. Keep in mind that a large plethoric IVC will be present in signs of obstructive shock and any cause of elevated right sided cardiac pressures.
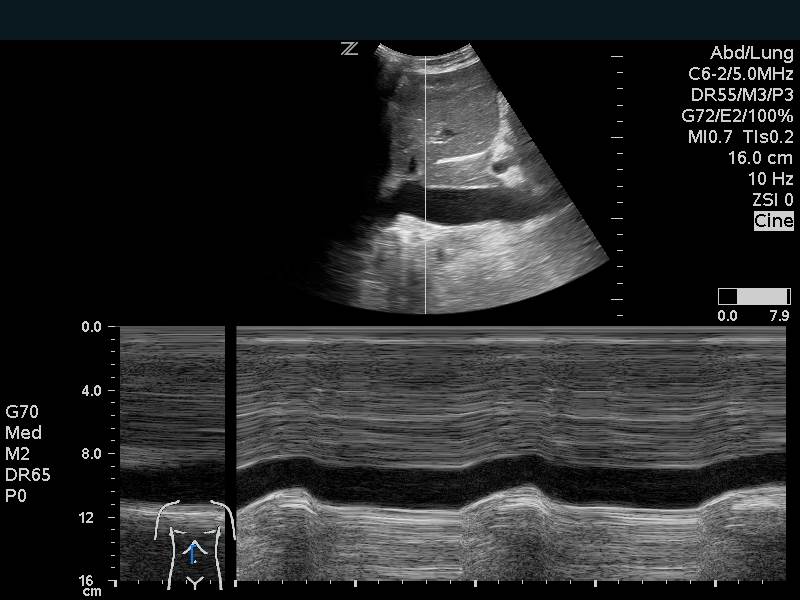
Figure 12. Inferior Vena Cava Respiratory variation on M-mode
Video 5. Normal Inferior Vena Cava with mild respiratory collapse
Video 6. Inferior Vena Cava with >50% respiratory collapse
Video 7. Large inferior vena cava with minimal respiratory collapse
TAPSE
The tricuspid annular plane systolic excursion (TAPSE) is a measurement of the right-sided systolic function. In the emergency department, this is most commonly employed to assess for signs of right heart strain in a patient with suspected or confirmed pulmonary embolism. This is a good prognostic test, although insufficiently sensitive for the diagnosis of any pulmonary embolism.16 On the apical four chamber view, place the m-mode cursor over the lateral annulus of the tricuspid valve. This provides a waveform that can be measured from peak to trough. Measurements less than 16 mm are considered indicative of poor right ventricular function and correlate with increased mortality.17
Video 8. Using M-mode to obtain TAPSE
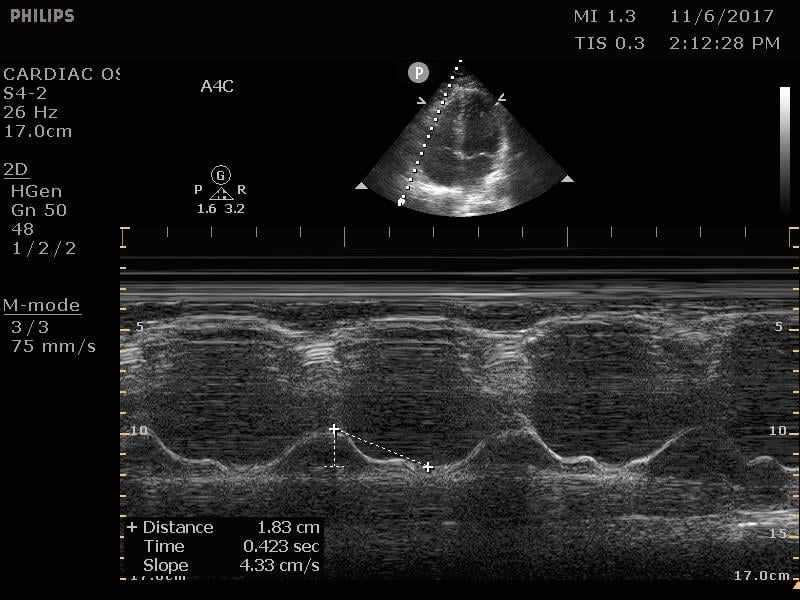
Figure 13. Normal TAPSE as measured on M-mode
Mitral Valve Inflow
The mitral valve inflow is obtained by placing the pulse wave doppler gate at the tip of mitral leaflets in the apical four chamber view. In cases of suspected cardiac tamponade, a respiratory variability of greater than 25% is concerning for an exaggerated variation due to tamponade physiology.18 Although more advanced, this measurement can also be used for diastology.
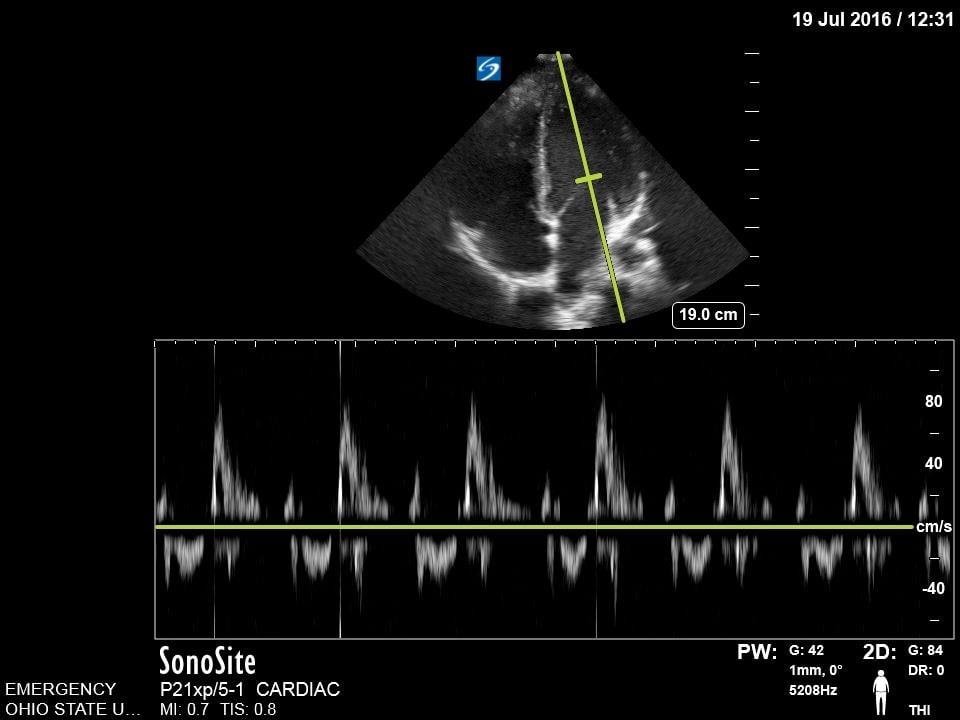
Figure 14. Normal Mitral valve inflow on pulse wave doppler
Pathology
Effusion, Trauma, and Tamponade
- Pericardial effusions are common and range from benign to life threatening.
- In contrast to an effusion, epicardial fat pads are isolate to the anterior of the heart and often have increased echogenicity.
- In the setting of trauma, significant effusion may signify cardiac injury.
- The parasternal long axis view can be helpful in distinguishing between pericardial (anterior to descending thoracic aorta) and pleural (posterior to the DTA) effusions.
- Findings of tamponade on echocardiography include right ventricular diastolic collapse, right atrial systolic collapse, plethoric IVC, and increased inflow variation.19
- Pericardial tamponade is potentially lethal without intervention. Intuitively POCUS can decrease time to intervention although to date this is supported only by weak evidence.20
Video 9. Subxiphoid view of pericardial effusion with cardiac tamponade physiology. Note circumferential pericardial effusion, right ventricular diastolic collapse
Heart Failure
- There are many patients who present to the emergency department with concern for acute heart failure or fluid overload. Ultrasound can decrease the time to diagnosis in these patients.21,22
- Findings include reduced systolic function or diastolic dysfunction. Poor systolic function can be visually estimated which has been shown to be equivalent to measurements. Alternately, you can measure EPSS, fractional shortening, or many other measurements.
- Isolated diastolic dysfunction can be present without systolic dysfunction. This is a complex determination often requiring many advanced measurements; however, measuring the mitral valve inflow E and A wave as well as tissue doppler of the mitral annulus to obtain the e’ and a’ waves can be helpful in this diagnosis.23
- In addition to focused echocardiography, evaluating the lung fields for B-lines will increase the accuracy for the diagnosis.24
- Video 10. Parasternal long axis view of hyperdynamic systolic function
Video 11. Parasternal long axis view of severely reduced systolic function
Right Heart Strain
- Pulmonary embolism represents a broad spectrum of disease. Patients with evidence of right heart strain have worse prognosis and may benefit from more advanced therapies.
- Focused ultrasound has been shown to accurately detect right heart strain more accurately than CT or serum markers with sensitivity of 100% and specificity of 99% in one study.7
- Right heart strain alone is not sensitive for the diagnosis of pulmonary embolism.
- Findings suggestive of right heart strain are:
- Increased RV diameter. Usually 60% of the LV's size, when the RV size approaches the same size of the LV it is pathologically enlarged.
- Septal bowing. When the right ventricle bows towards the left this indicates increased right-sided pressures. This appears as a “D-sign” on a parasternal short axis.
- McConnell’s sign. This is an akinetic right ventricle with hyperkinetic or preserved function of the apex.
Video 12. Apical four chamber view of right ventricular dilation and septal bowing
Video 13. Parasternal short axis view with D sign
Video 14. McConnell’s Sign
- A TAPSE can be measured to evaluate the right heart systolic function. A TAPSE <16mm signifies increased mortality.17
- It can be difficult to distinguish acute from chronic right heart strain as all of the above findings can occur in chronic pathology. Right ventricular hypertrophy as measured by the anterior wall thickness >5mm indicates possible chronic elevated pressures. The 60/60 rule, although complex, can also be helpful in this scenario.25
Cardiac Arrest
- Ultrasound has proven useful in cardiac arrest at prognosticating survival, although the best studies have not provided information on neurologic outcomes.9
- Ultrasound in cardiac arrest is assessing both the presence of cardiac activity and evidence of etiology of the cardiac arrest. Patients with cardiac activity have odds ratio of 3.6 for survival to admission.26
- Isolated valve fluttering or myocardial twitching likely does not indicate a perfusing rhythm. Patients without cardiac activity have low likelihood of survival.
- Patients with severely reduced cardiac activity may present pulseless but benefit from more tailored therapy compared to standard ACLS treatment algorithms.27
- Care must be taken to avoid delaying chest compressions while performing ultrasound during arrest.28
- Transesophageal echocardiography can be performed in the emergency department during cardiac arrest and can offer more cardiac windows and ongoing cardiac assessment during compressions.29
- Video 15. Cardiac standstill
Video 16. Cardiac Arrest with initial cardiac activity, cardiac standstill, and compressions
V. Pearls and pitfalls
- Scan in a systematic fashion. Moving the probe in a coordinated fashion allows access to cardiac windows as the operator manipulates the transducer. Often larger circular motions are needed to find the best sonographic window. Then smaller refining movements can improve the image.
- Find sonographic landmarks that can be used as points of reference to identify surrounding anatomy. Pattern recognition of key cardiac shapes (especially the location of the apex, valves, and papillary muscles) help the novice sonographer anchor their scanning and adjust the angle of the probe to recreate the intended standard images.
- Epicardial fat pads are usually isolated to the anterior heart and have internal echoes. Pericardial fluid usually collects in the dependent posterior pericardial space and can be seen surrounding the myocardium anterior to the descending aorta. A left sided pleural effusion will be located posterior to the descending aorta.
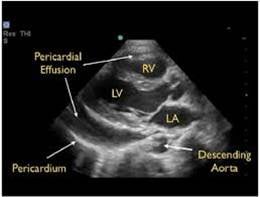
- Figure 15. Parasternal long axis showing pericardial effusion anterior to descending thoracic aorta
- Clotted blood in the pericardial space may have more hypoechoic appearance.
- Cardiac tamponade is a clinical diagnosis. Place the echocardiographic findings in the context of the patient’s clinical status.
- Not all acute heart failure exacerbations have poor systolic function. This is why knowledge of diastolic measurements can be helpful.
- When comparing ventricular size, ensure that you are visualizing the correct ventricle. These findings can be helpful: the descending thoracic aorta lies behind the left atrium, the left ventricular outflow tract will come from the left ventricle, and the moderator band is present in the right ventricle.
- Right heart strain alone is not sensitive for the diagnosis of acute pulmonary embolism. Additionally, when present, right heart strain can be from acute or chronic causes.
- The absence of cardiac activity during cardiac arrest is associated with non-survival, but it does not rule out survival. There is little evidence that the presence of cardiac activity on ultrasound is associated with survival with a good neurologic outcome.
Be cautious of “scope creep.” There are many other cardiac findings that experienced sonologists will be able to assess such as regional wall motion abnormalities, valvular abnormalities, cardiac tumors, vegetations, cardiomyopathies, and advanced doppler measurements. Recognize that the majority of these are not supported by national guidelines, have variable accuracies when performed at the point-of-care, and should only be utilized by users with firm understanding of the strengths and limitations of these examinations.
VI. References
- Ultrasound guidelines: Emergency, point-of-care and clinical ultrasound guidelines in medicine. [policy statement]. Ann Emerg Med. 2017;69(5):e27-e54.
- Labovitz AJ, Noble VE, Bierig M. Focused cardiac ultrasound in the emergent setting: a consensus statement of the American Society of Echocardiography and American College of Emergency Physicians. J Am Soc Echocardiogr. 2010;23(12):1225-30.
- Plummer D, Brunette D, Asinger R, Ruiz E. Emergency department echocardiography improves outcome in penetrating cardiac injury. Ann Emerg Med. 1992;21(6):709-12.
- Moore CL, Rose GA, Tayal VS, et al. Determination of left ventricular function by emergency physician echocardiography of hypotensive patients. Acad Emerg Med. 2002;9(3):186-93.
- Mandavia DP, Hoffner RJ, Mahaney K, et al. Bedside echocardiography by emergency physicians. Ann Emerg Med. 2001;38(4):377-82.
- Russell FM, Ehrman RR, Cosby K. Diagnosing acute heart failure in patients with undifferentiated dyspnea: a lung and cardiac ultrasound (LuCUS) protocol. Acad Emerg Med. 2015;22(2):182-91.
- Weekes AJ, Thacker G, Troha D. Diagnostic accuracy of right ventricular dysfunction markers in normotensive emergency department patients with acute pulmonary embolism. Ann Emerg Med. 2016; 68(3):277-91.
- Barbier C, Loubières Y, Schmit C. Respiratory changes in inferior vena cava diameter are helpful in predicting fluid responsiveness in ventilated septic patients. Intensive Care Med. 2004;30(9):1740-6.
- Tsou PY, Kurbedin J, Chen YS. Accuracy of point-of-care focused echocardiography in predicting outcome of resuscitation in cardiac arrest patients: A systematic review and meta-analysis. Resuscitation. 2017;114:92-9.
- Bustam A, Noor Azhar M, Singh Veriah R, et al. Performance of emergency physicians in point-of-care echocardiography following limited training. Emerg Med J. 2014;31(5):369-73.
- Bahner DP, Hughes D, Royall NA. I-AIM: a novel model for teaching and performing focused sonography. J Ultrasound Med. 2012;31(2):295-300.
- Moore C. Current issues with emergency cardiac ultrasound probe and image conventions. Acad Emerg Med. 2008;15(3):278-84.
- McKaigney CJ, Krantz MJ, La Rocque CL, et al. E-point septal separation: a bedside tool for emergency physician assessment of left ventricular ejection fraction. Am J Emerg Med. 2014;32(6):493-7.
- Nagdev AD, Merchant RC, Tirado-Gonzalez A, et al. Emergency department bedside ultrasonographic measurement of the caval index for noninvasive determination of low central venous pressure. Ann Emerg Med. 2010;55(3):290-5.
- Corl KA, George NR, Romanoff J. Inferior vena cava collapsibility detects fluid responsiveness among spontaneously breathing critically-ill patients. J Crit Care. 2017;41:130-7.
- Daley J, Grotberg J, Pare J. Emergency physician performed tricuspid annular plane systolic excursion in the evaluation of suspected pulmonary embolism. Am J Emerg Med. 2017;35(1):106-11.
- Lobo JL, Holley A, Tapson V. Prognostic significance of tricuspid annular displacement in normotensive patients with acute symptomatic pulmonary embolism. J Thromb Haemost. 2014;12(7):1020-7.
- Shyy W, Knight RS, Kornblith A, et al. Point-of-care diagnosis of cardiac tamponade identified by the flow velocity paradoxus. J Ultrasound Med. 2017;36:2197–2201.
- Goodman A, Perera P, Mailhot T, et al. The role of bedside ultrasound in the diagnosis of pericardial effusion and cardiac tamponade. J Emerg Trauma Shock. 2012;5(1):72-5.
- Alpert EA, Amit U, Guranda L, et al. Emergency department point-of-care ultrasonography improves time to pericardiocentesis for clinically significant effusions. Clin Exp Emerg Med. 2017;4(3):128-32.
- Zanobetti M, Scorpiniti M, Gigli C. Point-of-care ultrasonography for evaluation of acute dyspnea in the ED. Chest. 2017;151(6):1295-1301.
- Russell FM, Ehrman RR. A modified lung and cardiac ultrasound protocol saves time and rules in the diagnosis of acute heart failure. J Emerg Med. 2017;52(6):839-845.
- Ferre RM, Chioncel O, Pang PS, et al. Acute heart failure: the role of focused emergency cardiopulmonary ultrasound in identification and early management. Eur J Heart Fail. 2015;17(12):1223-7.
- Al Deeb M, Barbic S, Featherstone R, et al. Point-of-care ultrasonography for the diagnosis of acute cardiogenic pulmonary edema in patients presenting with acute dyspnea: a systematic review and meta-analysis. Acad Emerg Med. 2014;21(8):843-52.
- Fields JM, Davis J, Girson L. Transthoracic echocardiography for diagnosing pulmonary embolism: A systematic review and meta-analysis. J Am Soc Echocardiogr. 2017;30(7):714-723.e4.
- Gaspari R, Weekes A, Adhikari S. A retrospective study of pulseless electrical activity, bedside ultrasound identifies interventions during resuscitation associated with improved survival to hospital admission. A REASON Study. Resuscitation. 2017;120:103-7.
- Gaspari R, Weekes A, Adhikari S. Emergency department point-of-care ultrasound in out-of-hospital and in-ED cardiac arrest. 2016;109:33-9.
- Huis In 't Veld MA, Allison MG, Bostick DS. Ultrasound use during cardiopulmonary resuscitation is associated with delays in chest compressions. Resuscitation. 2017;119:95-8.
- Fair J, Mallin M, Mallemat H. Transesophageal echocardiography: Guidelines for point-of-care applications in cardiac arrest resuscitation. Ann Emerg Med. 2018;71(2):201-7.