July 16, 2020
Physics and Technical Facts for the Beginner
Arthur Au, MD; Michael Zwank, MD, FACEP
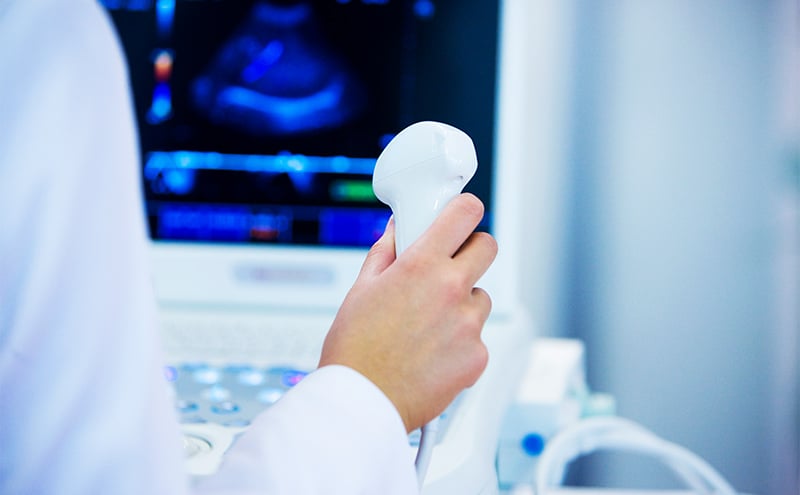
This chapter serves as a basic overview of ultrasound physics and image acquisition. This includes standard machine functionality and transducer manipulation.
I. Basic Ultrasound Physics
- Sound is a series of pressure waves propagating through a medium
- One cycle of the acoustic wave is composed of a complete positive and negative pressure change
- The wavelength is the distance traveled during one cycle
- The frequency of the wave is measured in cycles per second or Hertz (cycles/s, Hz) (Illustration 1)
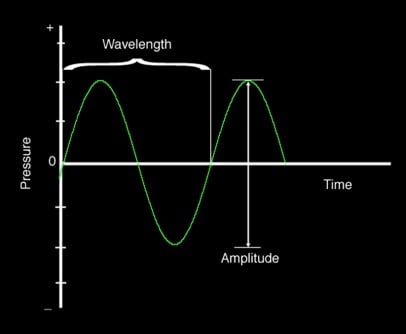
- Illustration 1. The illustration shows a schematic drawing of wave length, pressure and amplitude.
- For most humans audible sound ranges between 20 Hz and 20,000 Hz (20 kHz)
- Ultrasound refers to any sound waves with frequencies greater than 20kHz
- Diagnostic ultrasound typically uses frequencies between 2 and 20 million Hertz (Megahertz - MHz)
- The propagation speed of an acoustic wave traveling through a specific medium is determined by the stiffness of that medium
- The greater the stiffness, the faster the wave will travel. This means that sound waves travel faster in solids than liquids or gases
- Sound waves travel through human soft tissue at approximately 1540 m/s (about one mile per second)
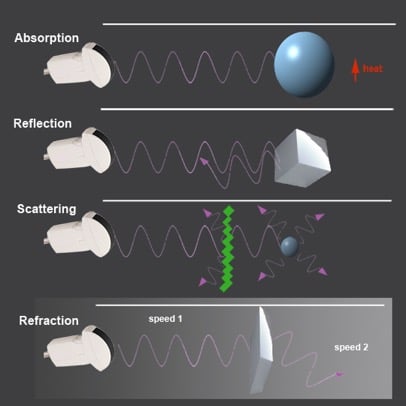
- Attenuation is the loss of intensity and amplitude as sound waves travel through a medium
- The major source of attenuation in soft tissue is absorption, the conversion of acoustic energy into heat
- Other causes of attenuation are reflection, refraction and scatter
- Illustration 2. Hearing range in various animals and humans.
- These occur as sound waves encounter a boundary between two different media
- Some of the waves bounce back towards the source as an echo (reflection)
- The angle of approach (incidence) is identical to the angle of the reflection
- The remaining sound wave travels through the second medium (or tissue)
- If the two mediums have different “stiffness” the resulting change in propagation speeds will cause the wave to be “bent” from its original path (refraction)
- The angle of incidence will be different from the angle of transmission
- The amount of deflection is proportional to the difference in the two tissues ‘stiffness’
- Scatter occurs when ultrasound waves encounter a medium with a heterogeneous surface
- While most of the original wave continues to travel in its original path, a small portion of the sound waves are scattered in random directions
- The production and interpretation of ultrasound waves is based on the so-called ‘pulse-echo-principle’
- The source of the ultrasound wave is the piezoelectric crystal, which is housed in the transducer
- These crystals have the ability to transform an electrical current into mechanical pressure waves (ultrasound waves) and vice versa
- Once the ultrasound wave is generated and travels through the medium, the crystal switches from ‘sending’ into ‘listening’ mode and awaits returning ultrasound echoes
- Transducers spend over 99% of the time “listening” for returning waves
- This cycle is repeated several million times per second
- Returning sound waves are converted into images on the ultrasound monitor.
- Based off direction, timing and amplitude of returning waves
- Understanding the relationship between ultrasound frequency and image resolution helps when choosing the ideal probes and frequencies
- Lower frequencies are able to penetrate deeper into tissue but show poorer resolution (fine detail)
- Higher frequency ultrasound will display more detail with a higher resolution though with less depth penetration
II. Ultrasound Modes
- B-mode or ‘brightness mode’ provides structural information utilizing different shades of gray (or different ‘brightness’) in a two-dimensional image (Figure 1)
- Figure 1. B-Mode image of free fluid in the right upper quadrant
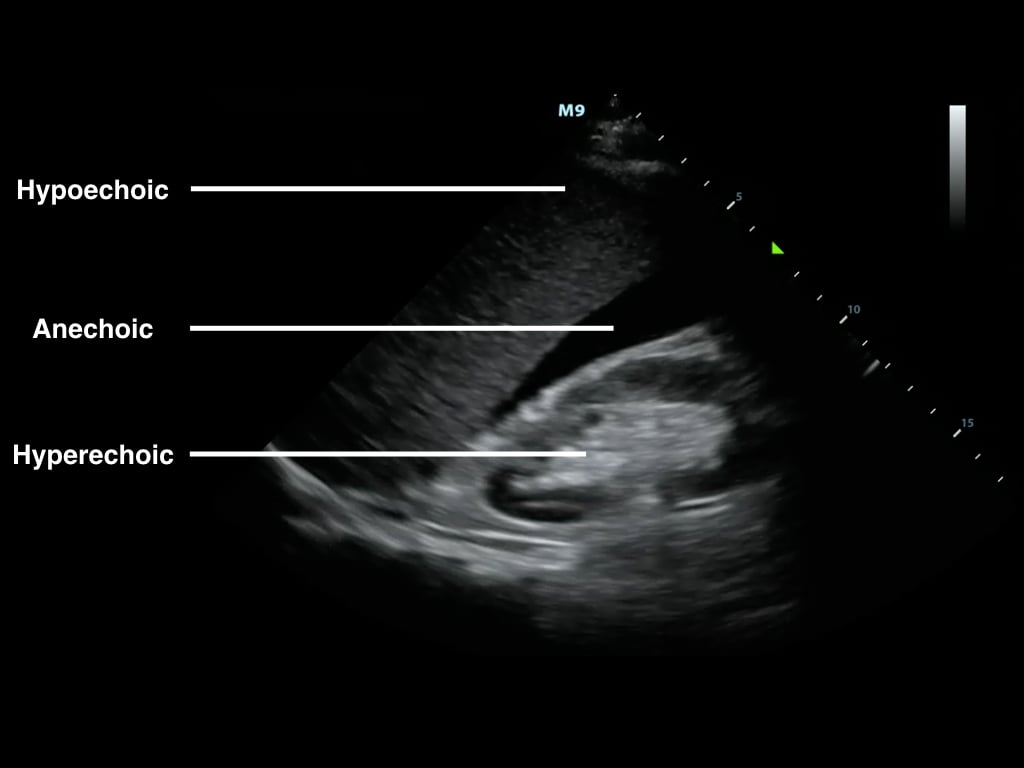
- Brightness is determined by the amplitude of returning echoes
- Anechoic/Echolucent – Complete or near absence of returning sound waves, area is black
- Hypoechoic - Structure has very few echoes and appears darker than surrounding tissue
- Hyperechoic/Echogenic – Large amplitude of returning echoes appears brighter than surrounding tissue
- M-mode (motion mode) captures returning echoes in only one line of the B-mode image displayed over time
- Movement of structures positioned in that line can now be visualized
- Often M-mode and B-mode are displayed together in real-time on the ultrasound monitor (Figure 2, Video 1)
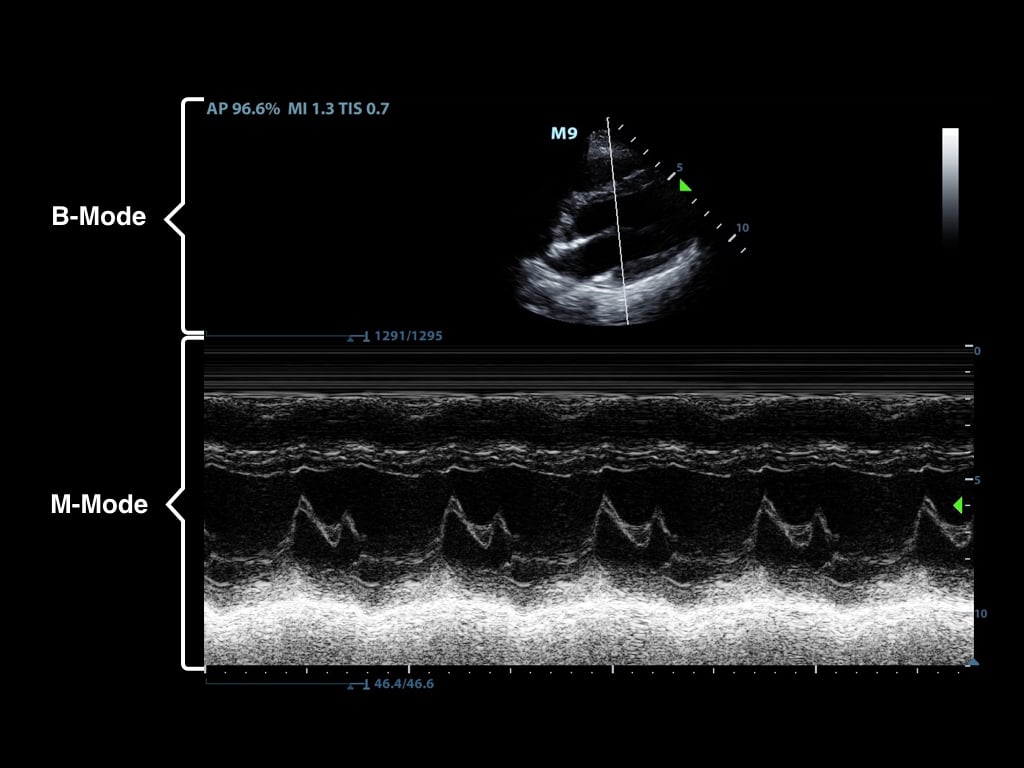
- Figure 2. M-Mode (lower portion of the image) combined with B-Mode image. In this still image the M-mode captures the movement of a particular part of the heart.)
Video 1. M-Mode showing movement of the mitral valve
- Doppler modes examine the characteristics of direction and speed of tissue motion and blood flow and present it in audible, color or spectral displays
- Utilizes a phenomenon called ‘Doppler shift,’ which is a change in frequency from the sent to the returning sound wave
- These changes or ‘shifts’ are generated by sound waves reaching moving particles.
- The change of frequency/amount of shift correlates with the velocity and direction of particle motion
- Color Doppler ultrasound is also called color-flow ultrasound.
- It is used to show blood flow or tissue motion in a selected two-dimensional area
- Direction and velocity of tissue motion and blood flow are color coded and superimposed on the corresponding B-mode image (Figure 3, Video 2)
- Typically, red depicts movement towards the transducer, while blue depicts movement away from the transducer
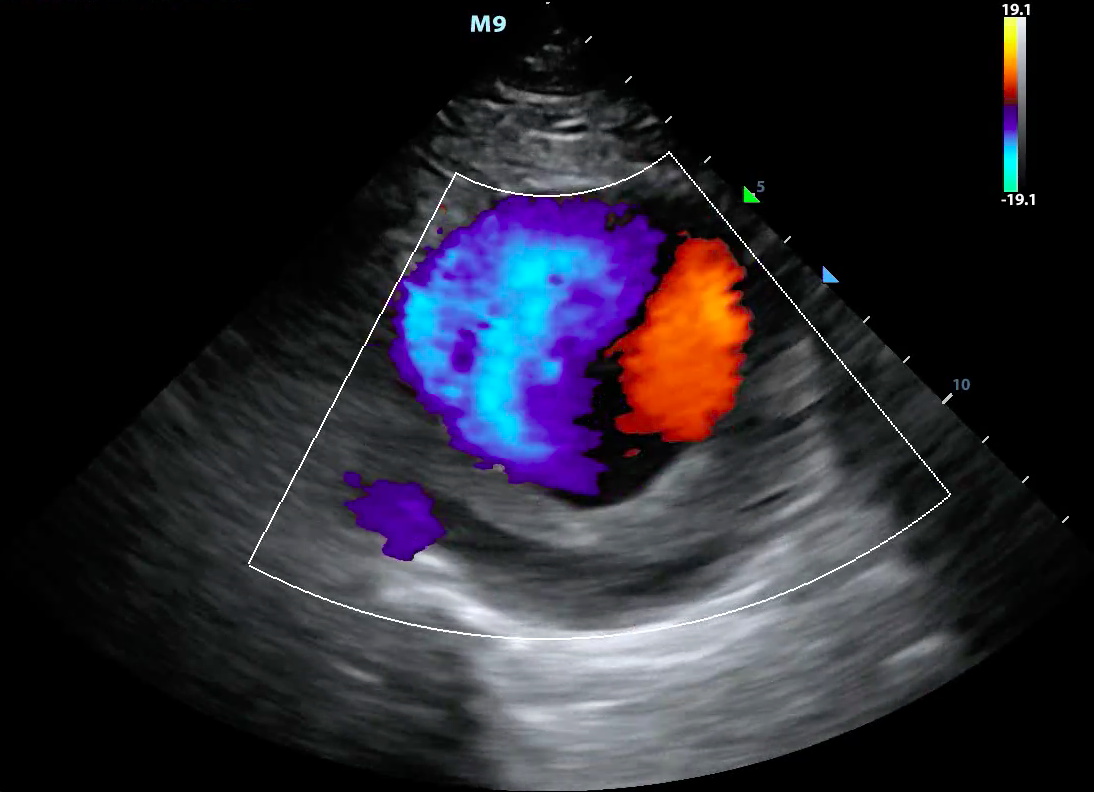
- Figure 3. Color doppler showing turbulent blood flow in a large abdominal aortic aneurysm
Video 2. Color doppler showing turbulent blood flow in a large abdominal aortic aneurysm
- Power Doppler looks only at the amplitudes of the returning frequency shifts.
- It does not examine flow velocity or the direction of flow
- This allows for detection of movement in very low flow states (Figure 4)
- This is of use when examining vascular emergencies such as testicular or ovarian torsion
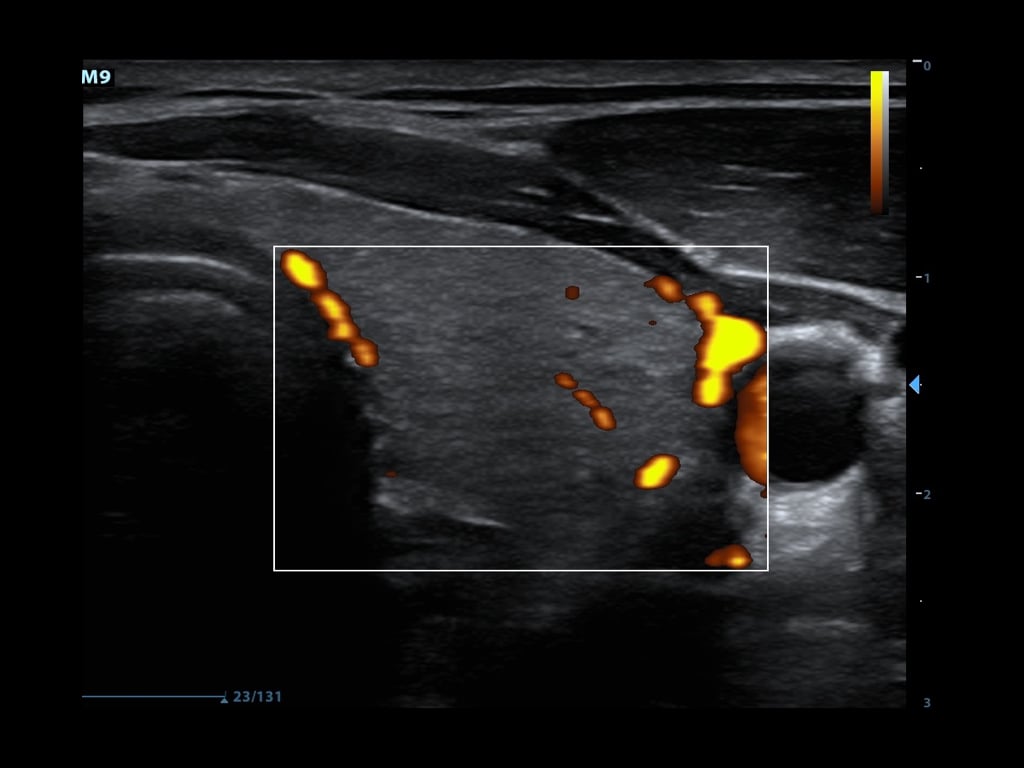
- Figure 4. Power doppler showing blood flow in thyroid tissue
- Spectral Doppler consists of a continuous and pulsed-wave form
- Pulsed-wave spectral Doppler
- Transducer sends pulses of ultrasounds to a predetermined depth
- Transducer then listens for returning echoes to determine flow velocities at that given location
- The “spectrum” of the returned Doppler frequencies are plotted in a characteristic two-dimensional display (Figure 5)
- Venous flow demonstrates a more continuous, band like shape
- Arterial flow shows a more triangular shape1-8
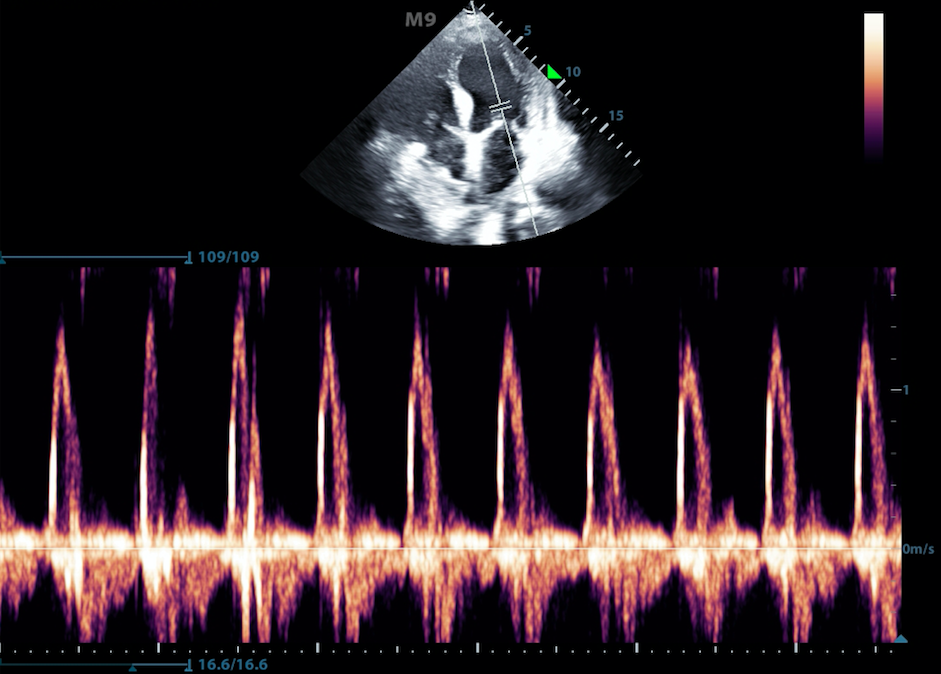
- Figure 5. Pulse wave doppler of flow through the mitral valve
- Continuous wave Doppler
- Transducer continuously sends and receives signals
- This allows for detection of very high frequency signals (Figure 6)
- Velocities along the entire line of interrogation are measured and not localizable
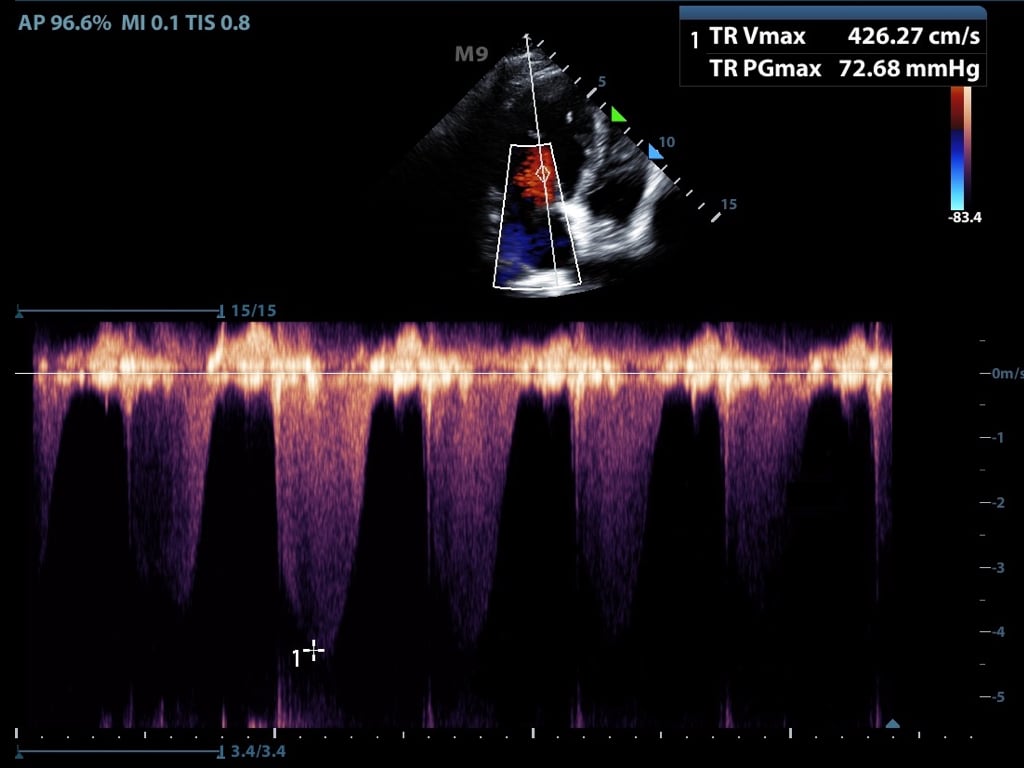
- Figure 6. Continuous flow doppler of tricuspid regurgitation
- Pulsed-wave spectral Doppler
III. Artifacts
- Artifacts refer to something the machine depicts on the ultrasound image but does not exist in reality
- An artifact can be helpful interpreting the image or it can confuse the interpreter
- Several commonly encountered artifacts are mentioned below
Attenuation Artifacts:
- Shadowing is caused by partial or total reflection or absorption of the sound energy
- A much weaker signal returns from behind a strong reflector (air) or sound-absorbing structure (gallstone, kidney stone, bone) (Figure 7)
- Figure 7. Shadowing from gallstones and edge artifact at lateral wall of gallbladder
- A much weaker signal returns from behind a strong reflector (air) or sound-absorbing structure (gallstone, kidney stone, bone) (Figure 7)
- Edge Shadowing Artifact is a thin acoustic shadow behind lateral edges of cystic structures
- Sound waves encountering a cystic wall or a curved surface at a tangential angle are refracted with few echoes returning to the transducer (Figure 7)
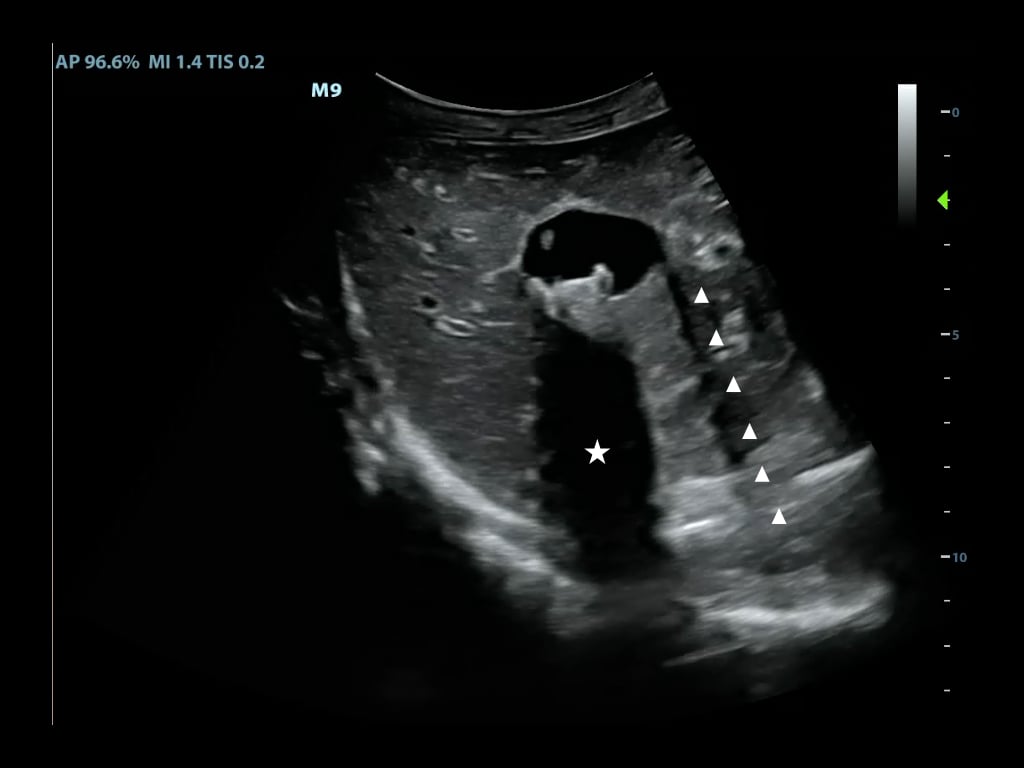
- In posterior enhancement, the area behind an echo-weak or echo-free structure appears brighter (more echogenic) than its surrounding structures
- Neighboring signals must pass through more attenuating structures and return with comparatively weaker echoes
- A common place for this to occur is posterior to the anechoic bladder (Figure 8)
- Figure 8. Posterior acoustic enhancement deep to the bladder and side lobe artifact
Propagation Artifacts:
- Reverberation occurs when sound encounters two highly reflective layers
- The sound is bounced back and forth between the two layers before returning to the transducer
- The probe detects prolonged travel time and correlates with a further distance, displaying additional ‘reverberated’ images in a deeper tissue layer (Figure 9)
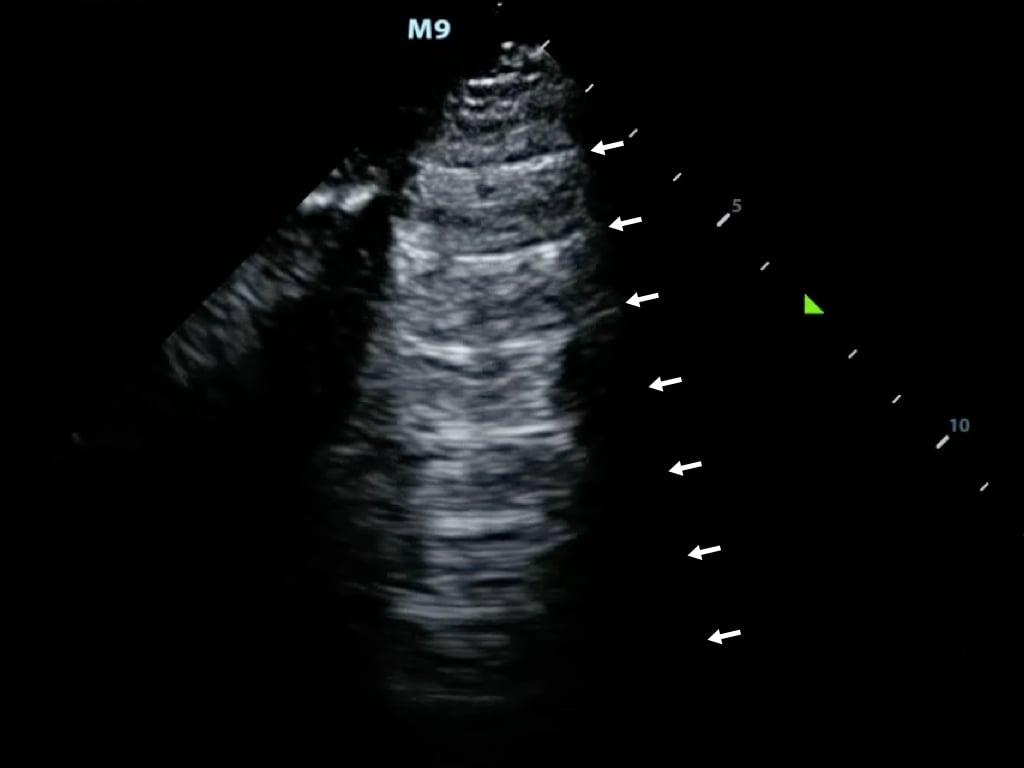
- Figure 9. Reverberation artifact from the pleural line
- Comet Tail Artifact is similar to reverberation.
- It is produced by the front and back of a very strong reflector (air bubble, BB gun pellet)
- The reverberations are spaced very narrowly and blend into a small band (Figure 10)
- Figure 10. Comet tail artifact from the pleural line
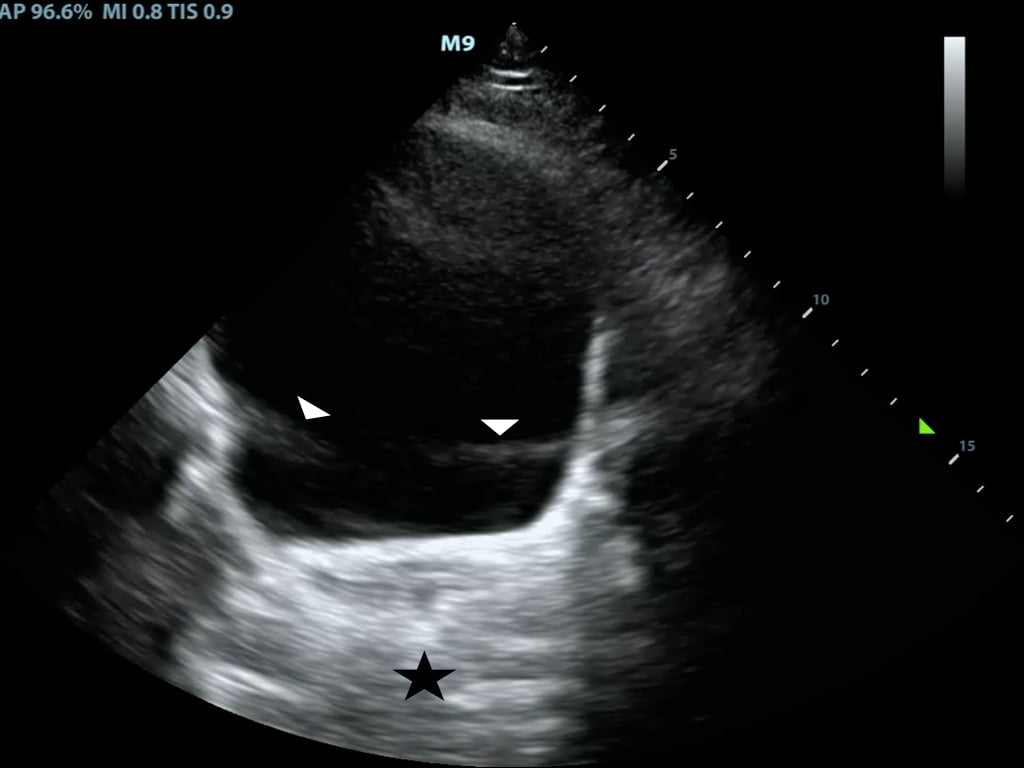
- Mirroring is a duplicate image depicted on the opposite side of a strong reflective surface.
- Waves reflect off of the strong reflective surface and encounter another structure such as liver tissue
- Echoes return towards the strong reflector and finally back to the transducer
- These echoes have a longer travel time and are depicted as an additional anatomic structure deep to the strong reflector (Video 3)
Video 3. Mirror artifact of the heart across the pericardium
Miscellaneous Artifacts:
- Ring Down artifact is caused by a resonance phenomenon from a collection of gas bubbles
- A continuous emission of sound occurs from the ‘resonating’ structure causing a long and uninterrupted echo (Figure 11)
- It appears very similar to the comet tail artifact
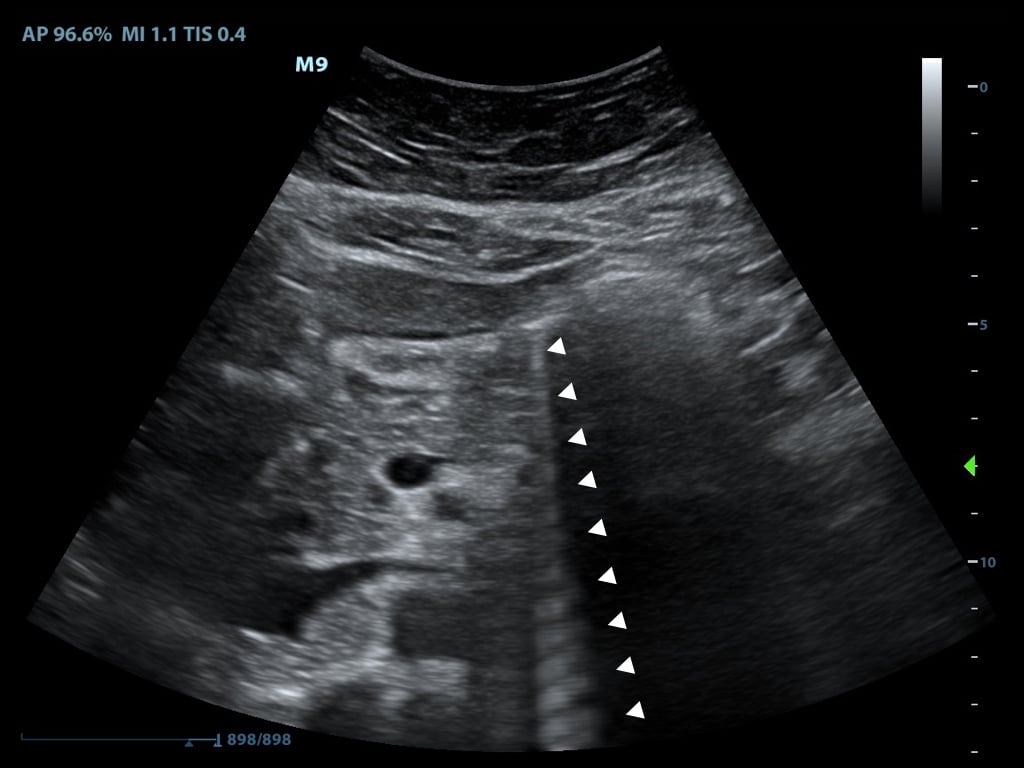
- Figure 11. Ring down artifact caused by bowel gas
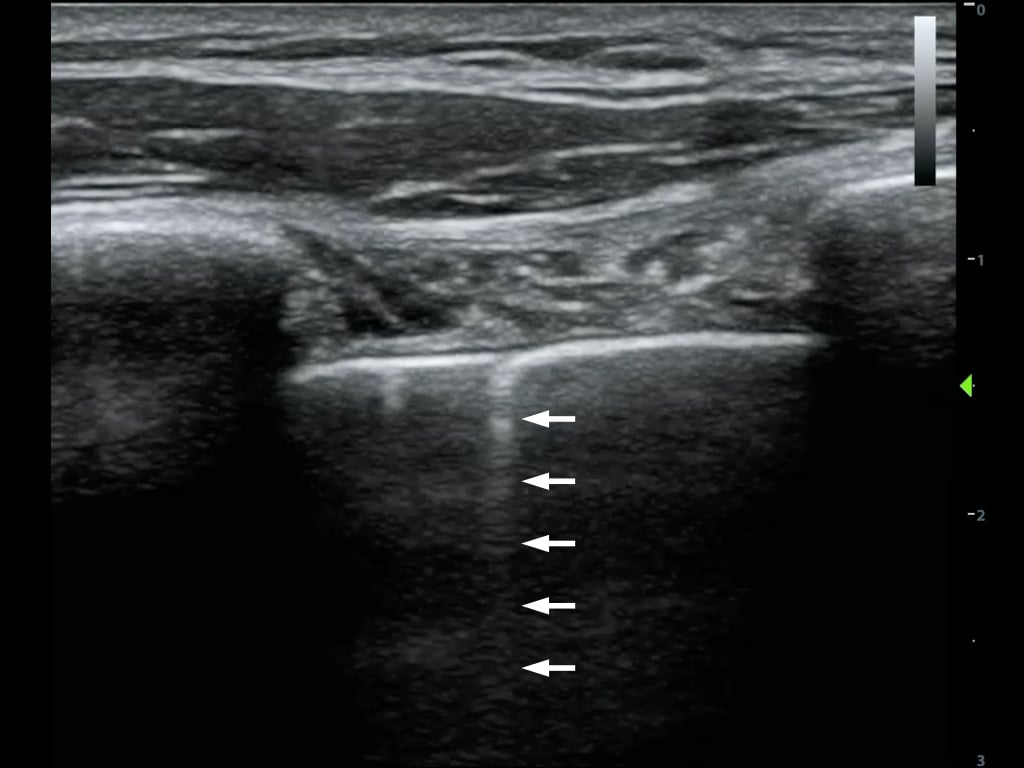
- Side Lobe artifact is caused when low energy ‘side lobes’ of the main ultrasound beam encounter a highly reflective object such as bowel gas
- When an echo from such a side lobe beam becomes strong enough and returns to the receiver, it is ‘assigned’ to the main beam and displayed at a false location
- Usually seen in hypoechoic or echo-free structures and appear as bright and rounded lines (see Figure 8)
IV. Probes
- Transducers consist of the active element (the piezoelectric crystal), damping material and a matching layer
- Different arrangements and forms of activation of the active element have led to a variety of probes
- The most common transducers utilized in the emergency department are listed below (Figure 12).
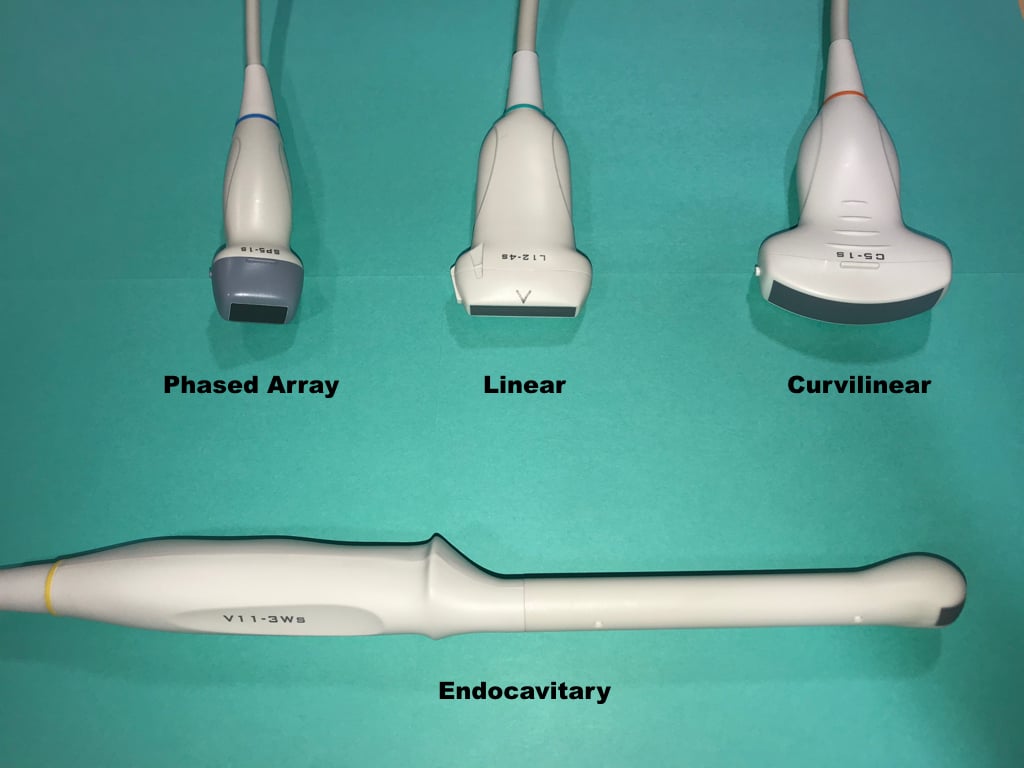
- Figure 12. Commonly used ultrasound probes
Curvilinear Probe (Curved Array):
- Produces a sector shaped image with a large curved footprint
- Low frequency
- Main utilization is transabdominal sonography
Phased Array Probe:
- Sector shaped image with a smaller footprint, ideal for use between ribs
- Low frequency
- Main utilization is cardiac and transabdominal sonography
Linear Probe:
- Produces a rectangular image with a straight flat footprint
- High frequency
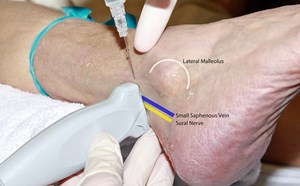
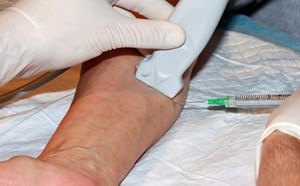
- Main utilization is vascular sonography, procedural guidance or evaluation of superficial soft tissue structures
Endocavitary Probe:
- Small curved footprint
- Medium frequency
- Main utilization is endovaginal or intraoral sonography
V. Image Acquisition / Probe Positions:9
- Transverse Plane (axial plane or cross-sectional) – In the supine patient, runs perpendicular to the ground
- Separates superior from inferior, or head from feet
- Sagittal Plane – In the supine patient, runs perpendicular to the ground
- Separates left from right
- Coronal Plane (frontal plane) – In the supine patient, runs parallel to the ground
- Separates anterior from posterior or front from back (Illustration 3)
- Oblique Plane - The probe is oriented neither parallel to, nor at right angles from, coronal, sagittal or transverse planes
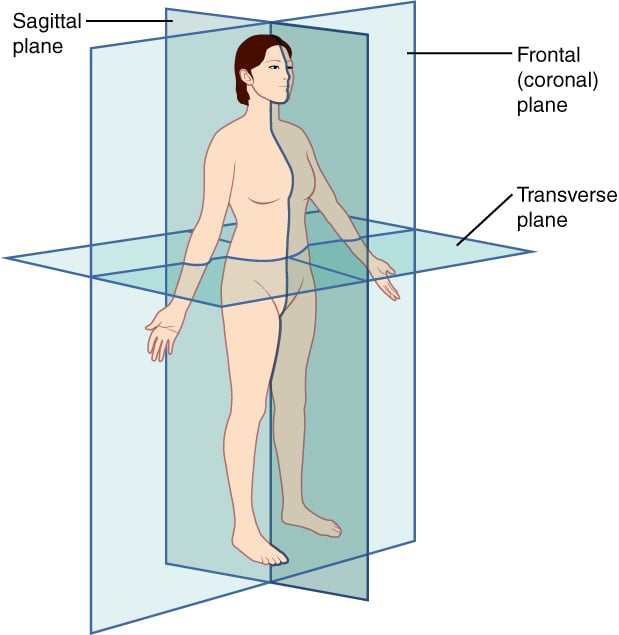
- Illustration 3. Spatial orientation and imaging planes (Credit: https://commons.wikimedia.org/wiki/File:Planes_of_Body.jpg)
Probe manipulation:
- Slide – Movement of the probe in the long axis along the surface of the body
- The probe remains perpendicular to the target
- Sweep – Movement of the probe in the short axis along the surface of the body
- The probe remains perpendicular to the target
- Rock – Movement of the probe along its long axis without changing the point of contact between the probe and the surface of the body
- Fan – Movement of the probe along its short axis without changing the point of contact between the probe and the surface of the body
- Pressure/compression – Movement of the probe into the surface of the body
- Footprint maintains contact with the surface of the body and the probe remains perpendicular to the target
- Rotate – Movement of the probe clockwise or counterclockwise
- Footprint maintains contact with the surface of the body and the probe remains perpendicular to the target
VI. Ultrasound Machine Functions
- This section lists several basic ultrasound machine functions
- They are more or less universal to all ultrasound equipment
- Information is kept as general as possible to make it applicable to most machines
- On/Off – Powers the machine on or off
- Sleep mode also available on many machines
- Select/Change Probes - Selects a specific probe
- Often allows selection of exam type as well
- Freeze – Freezes the current image
- Scroll - Moves the cursor within the image or navigates through menus (typically a touch pad or track ball)
- After freezing an image, moving the scroll ball will cycle through the last few seconds of imaging (these images are called cine-loops)
- Gain - Changes overall strength of returning echoes, functions as an amplifier, making the image brighter or darker
- Lower gain until fluid filled structures appear anechoic (Video 4)
Video 4. Optimizing gain
- Lower gain until fluid filled structures appear anechoic (Video 4)
- Time Gain Compensation (TGC) - Changes strength of returning echoes at various depths to help make the entire ultrasound image uniform brightness
- Depth Adjustment - Increases or decreases the depth of the ultrasound beam
- Save - Saves an image or clip to the hard drive
- Change Mode - Pushing the M-mode button will change the machine to M-mode, Doppler button to Doppler mode, color Doppler to color, etc.
- Most machines are set up so that a “dual” screen appears when certain modes are selected (B-Mode combined with Doppler or M-Mode) (See Video 1)
- Focus - Will change or add focal zones to the image, helping improve the image quality at a specific depth
VII. References
- Block B. The Practice of Ultrasound, A Step by Step Guide to Abdominal Scanning. Thieme, New York, 2004.
- Nielsen TJ, Lambert MJ. Physics and instrumentation. In: Ma OJ, Mateer JR., eds., Emergency Ultrasound. McGraw-Hill, New York,2003:45-66.
- Heller M, Jehle D. Fundamentals. In: Heller M, Jehle D, eds., Ultrasound in Emergency Medicine. Center Page: West Seneca, NY, 2nd edition,2002:1-40.
- Hofer M. In: Hofer M, eds., Sono-Grundkurs. Ein Arbeitsbuch für den Einstieg. 2nd edition, Thieme: Stuttgart,1997:6-10.
- Müsgen D. Physikalische und technische Grundlagen. In: Fürst G, Koischwitz D, eds., Moderne Sonographie. Thieme, Stuttgart,2000:1-23.
- Odwin CS, Dubinsky T, Fleischer AC. Appleton & Lange’s Review for the Ultrasonography Examination. 2nd edition, Appleton & Lange Reviews: McGraw-Hill, New York, 1997.
- Kremkrau FW. Diagnostic Ultrasound. 6th edition, W. B. Saunders Company, New York, 2002.
- Smith RS, Fry WR. Ultrasound instrumentation. Surg Clin N Am. 2004;84:953-71.
- Bahner DP, Blickendorf JM, Bockbrader M. Language of Transducer Manipulation: Codifying Terms for Effective Teaching. Ultrasound Med. 2016;35(1):183-8.

