Rapid Ultrasound for Shock and Hypotension (RUSH)
Hypotension Evaluation
Lori A. Stolz, MD, FACEP
Aalap Shah, MD, FACEP
Introduction and Indications
Early recognition and treatment of shock is beneficial in decreasing patient mortality.1,2 Identification of the cause of hypotension and shock in undifferentiated patients in the emergency department can be extremely challenging. Point-of-care ultrasound (POCUS) is effective at identifying the cause of shock and identifying appropriate next steps. Ultrasound is easily accessible, at the bedside, provides real time imaging and allows for serial examinations to assess for dynamic response to treatment.
Multiple approaches to POCUS evaluation of the patient in undifferentiated shock have been described in the literature.3-7 Despite some variability, these are all similar in that they focus on an algorithmic evaluation of multiple organs/body areas to classify the type of shock (below) and guide further resuscitation and interventions.
Early attempts at creating these protocols focused primarily on evaluating cardiac function as well as the inferior vena cava (IVC) diameter and collapsibility as a surrogate for volume status. Over time, this has evolved to also include evaluation of the lungs, aorta, abdomen, and even evaluation for deep venous thrombosis. The findings from each area are integrated to provide the most likely underlying cause of shock: Hypovolemic, Cardiogenic, Obstructive or Distributive.
Accuracy/sensitivity of ultrasound for this exam:
Research studies evaluating the utility of POCUS in shock report improved diagnostic accuracy. One study showed that diagnostic accuracy for determining the cause of undifferentiated shock improved from 60.6% to 85% with addition of a structured point of care ultrasound protocol. This also altered the initial management approach in as many as 50% of patients.8-10 Although further investigation needs to be done to evaluate the effect on patient centered outcomes such as morbidity and mortality, POCUS appears to be a promising tool in the management of these critically ill patients.11
The RUSH (Rapid Ultrasound for Shock and Hypotension) exam:
The RUSH exam was initially described as early as 2006 and has evolved through the years into many different yet similar protocols. The initial RUSH protocol, now often remembered by the pneumonic HI-MAP, evaluates 5 major areas (Heart, IVC, Morrison’s pouch or the focused assessment with sonography in trauma [FAST], Aorta, Pneumothorax). This has since been expanded to a broader view, or the “pump, tank, pipes” protocol.3,4 This refers to evaluating several organ systems and adds views to evaluate for pulmonary effusion and interstitial edema, as well as for DVT in the lower extremities. (Figure 1)
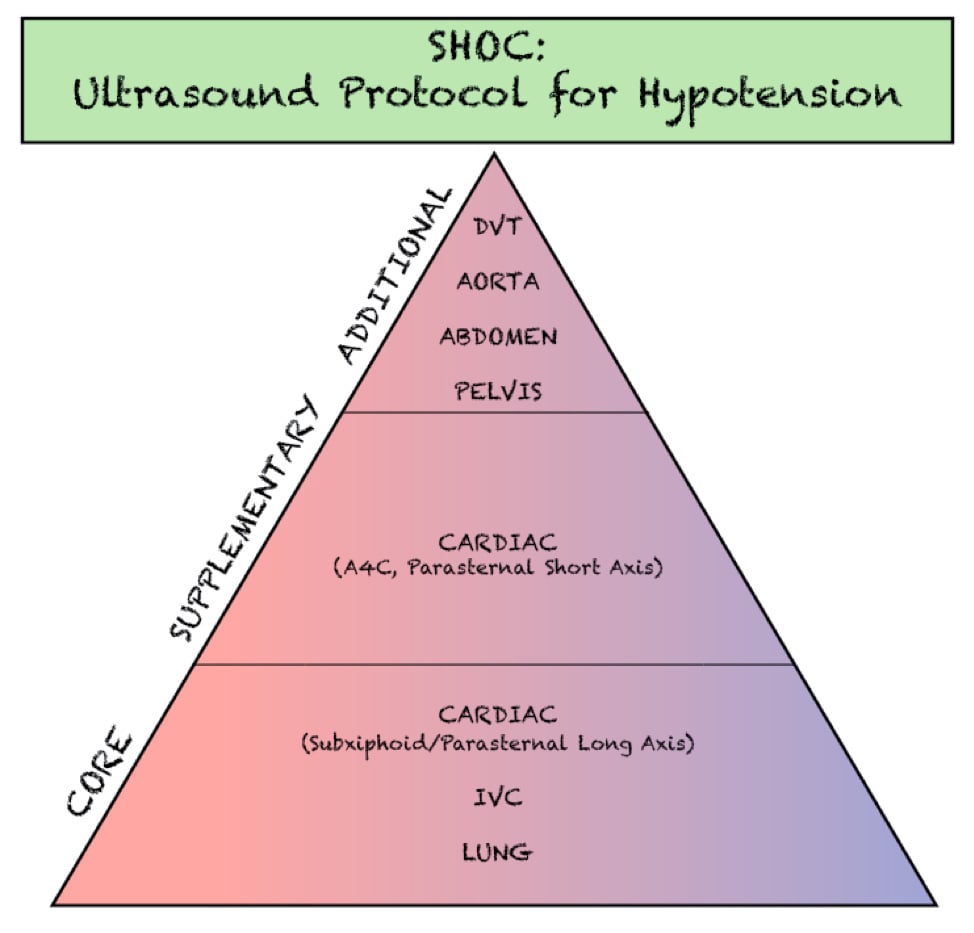
Figure 1. Components of the SHOC evaluation. Adapted from- Atkinson P, Bowra J, Milne J, et al. International Federation for Emergency Medicine Consensus Statement- Sonography in hypotension and cardiac arrest (SHoC)- An international consensus on the use of point of care ultrasound for undifferentiated hypotension and during cardiac arrest. CJEM. 2017;19(6):459-70.
The SHoC (Sonography in Hypotension and Cardiac arrest) Protocol
The SHoC protocol has been proposed as a method of streamlining previously described hypotension protocols into those components which are likely to be highest yield, given the cognitive load and time sensitive nature of the examination. By integrating disease incidence, test characteristics of each component of the POCUS exam, as well as expert opinion, the SHoC investigators propose a ‘core’ set of examinations which should be completed on all patients with undifferentiated shock, as well as a set of ‘supplemental’ examinations which should be performed if time permits. Any ‘additional’ views are left to physician discretion based on the clinical scenario. (Figure 2)
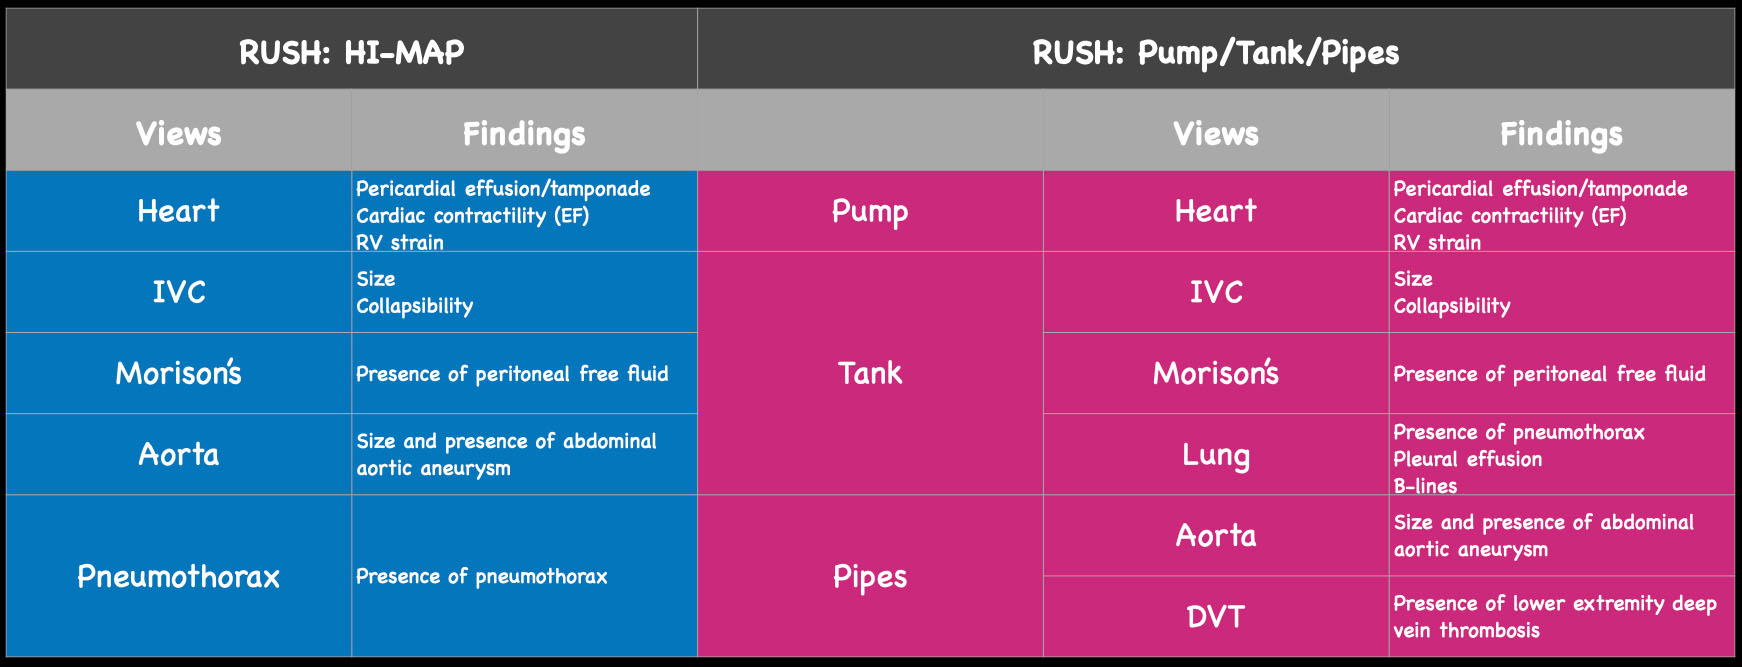
Figure 2. The views and findings in the RUSH exam. On the left, see original HI-MAP protocol and potential pathologic findings by view. On the right, expanded ‘pump, tank, pipes’ protocol and potential findings.
Components of Hypotension Evaluation
Cardiac
The cardiac component is essential to evaluation of a hypotensive patient as it can provide valuable information about cardiac physiology and etiology of shock. The goal of the cardiac portion of the examination is to classify presence or absence of pericardial effusion, pericardial tamponade, evaluate left and right ventricular contractility and chamber size and thus link these findings to the etiology of shock. Pericardial effusion with tamponade may be identified as a cause of obstructive shock. As fluid and pressure in the pericardial sac increases, early diastolic collapse of the right ventricular free wall is seen. (Video 1) This can be assessed visually in the parasternal long view by placing an M-mode line through the right ventricle (RV) and left ventricle (LV), including the interventricular septum and anterior leaflet of the mitral valve. (Figure 3) This allows for easy identification of right ventricular diastolic collapse, which is indicative of tamponade physiology.
Video 1. Parasternal long cardiac view which demonstrates large effusion with RV diastolic collapse
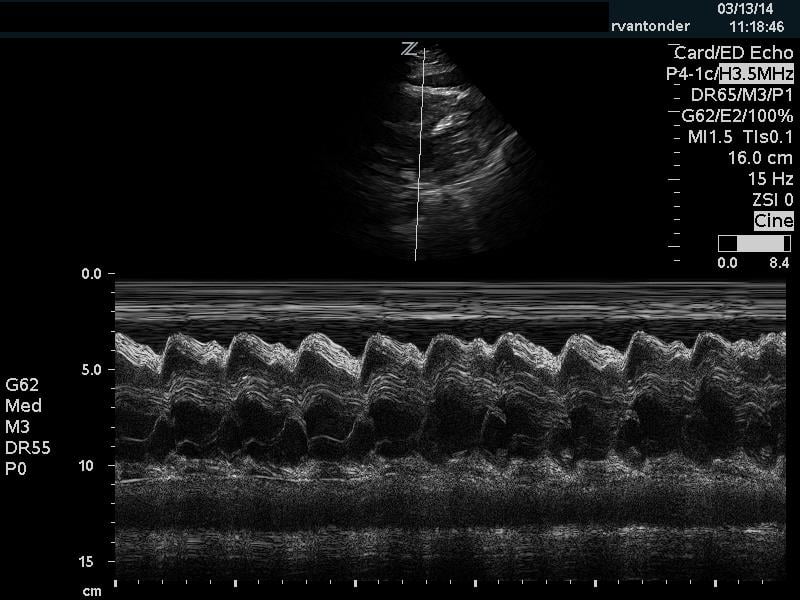
Figure 3. Right ventricular diastolic collapse viewed in M-mode. Note motion of mitral valve leaflet, in the mid-field. Valve opening indicates diastole, which can then be compared to the collapse of the right ventricle in the near field.
Additionally, when assessing for tamponade, it can be helpful to assess the mitral and tricuspid inflow variation. In pericardial tamponade, there is increased interventricular interdependence during filling exaggerating the respiratory variation flow through the atrioventricular valves. This can be performed in the apical four chamber view, by placing pulse wave doppler (PWD) over the area of either the mitral valve or tricuspid valve. (Figure 4) The velocities are then measured during expiration and inspiration. A mitral valve inflow variation of over 25% or tricuspid valve inflow variation over 40% is indicative of pulsus paradoxus and tamponade physiology. Additional findings in tamponade include a wide, plethoric IVC with minimal variation, as well as collapse of the right atrium during ventricular systole.
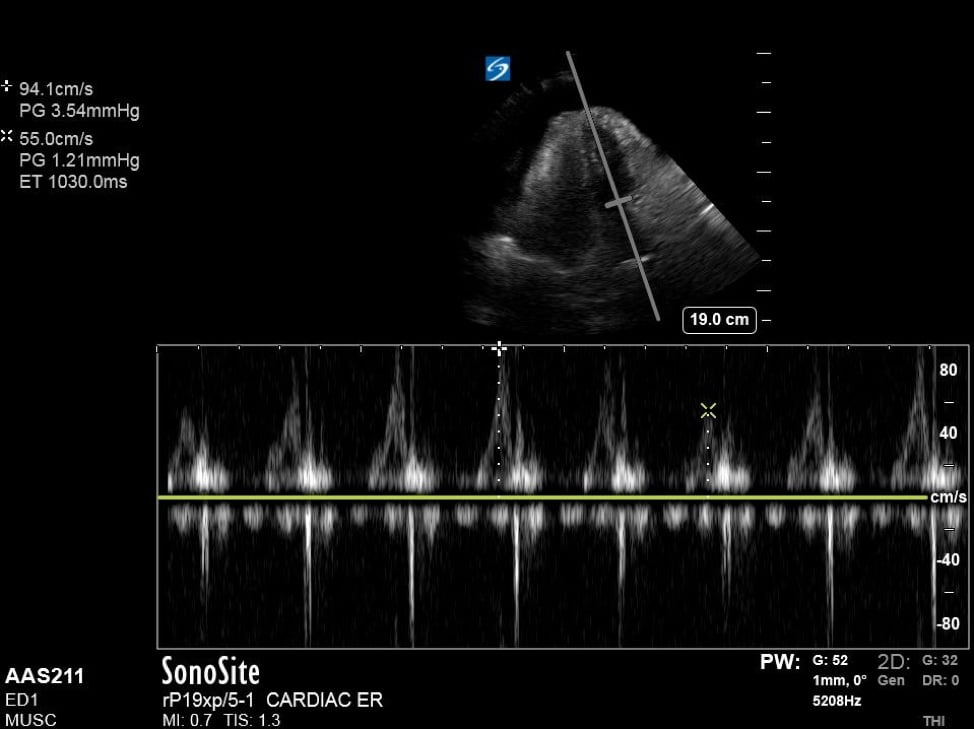
Figure 4. Apical 4 chamber view with excessive variation in mitral inflow velocities.
In assessing a hypotensive patient, it is also important to assess cardiac contractility. With hypodynamic cardiac contractility an element of cardiogenic shock may be present. (Video 2 and 3) If cardiac contractility is hyperdynamic, distributive or hemorrhagic shock may be present. (Video 4) Multiple methods have been described in assessing cardiac contractility, ranging from simply user estimation (the ‘eyeball’ method) as well measurements such as E-point septal separation (EPSS) and fractional shortening (FS). While studies have shown the experienced users are fairly accurate at simply estimating (ejection fraction) EF,12 less experienced users may benefit from using a method of calculation, such as EPSS or FS. The short-axis view at the mid-papillary level is useful for visual quantification of apparent reduction in chamber size during systole. Near or complete obliteration of the ventricular cavity during systole can be suggestive of hyperdynamic cardiac function or low volume state. Normal EF is suggested by approximately 50-70% reduction of chamber volume from end-diastole to end-systole, with values above and below that range classified as hyperdynamic and hypodynamic, respectively.
Video 2. Parasternal short axis cardiac view demonstrating hypodynamic LV function
Video 3. Parasternal long axis cardiac view demonstrating hypodynamic LV function
Video 4. Parasternal short axis cardiac view demonstrating hyperdynamic LV function
EPSS
In the parasternal long view, an M-mode line is placed through the anterior mitral leaflet. The distance is between the leaflet tip and interventricular septum is measured during the point in early diastole where the tip of the leaflet is closest to the septum. (Figure 5) A value of >7mm is highly suggestive of depressed cardiac contractility or low EF. (Figure 6) Note that this measurement is invalidated by the presence of valvular pathology or left ventricular/septal hypertrophy. This method is also not valid for assessing for hypercontractility.
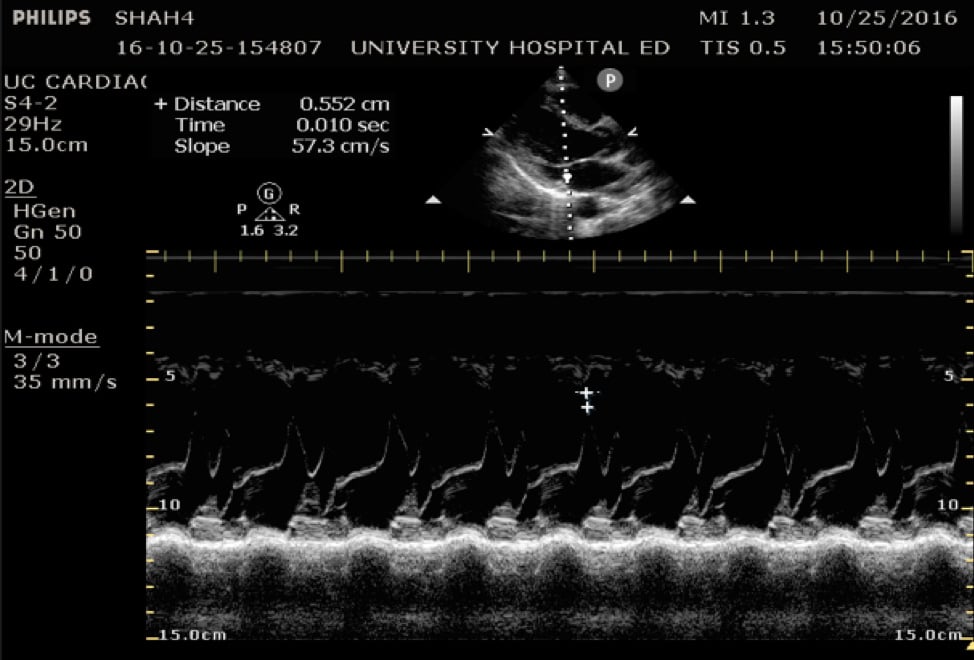
Figure 5. Image of normal EPSS measurement measured from the tip of the anterior mitral valve leaflet in diastole to the interventricular septum
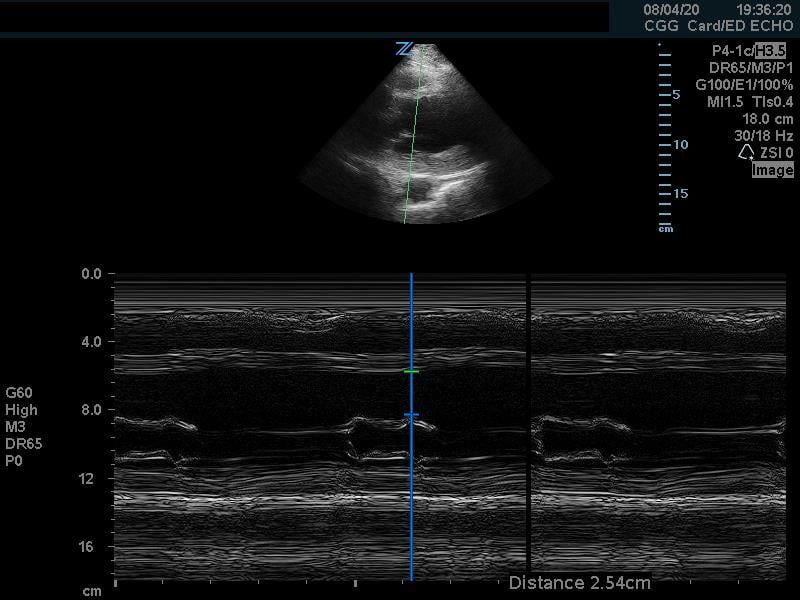
Figure 6. Abnormal EPSS measurement
Fractional Shortening
Fractional shortening can be used to estimate EF. This is performed by placing an M-mode spike through the anterior and posterior walls of the LV at the mid-LV in the parasternal short axis view. In M-mode, the diameter of the left ventricular cavity is measured in end-diastole (LVEDD) and end-systole (LVESD). One can then apply the below formula to obtain an estimation of EF%:
FS = (LVEDD-LVESD/LVEDD) x 100%
A normal EF is suggested by a percent FS between 25-45%. (Fig. 7,8)13
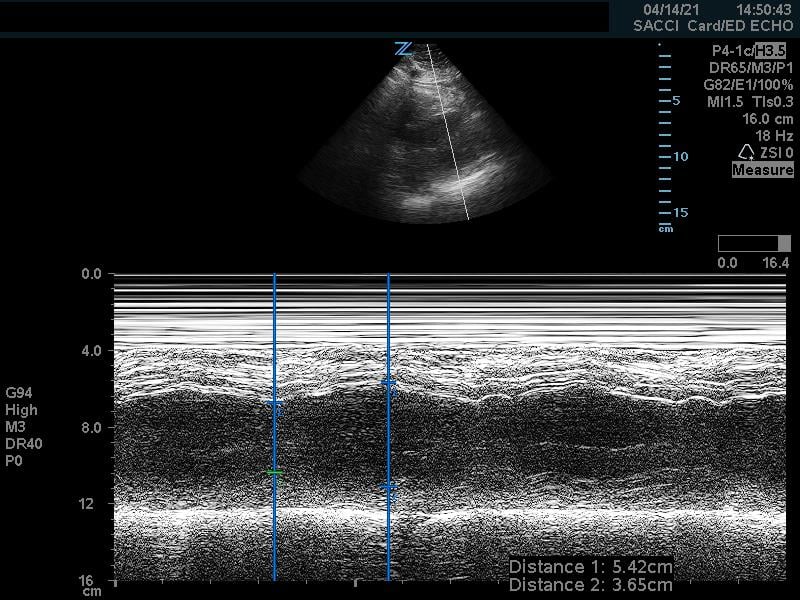
Figure 7. Fractional shortening measurement obtained using M-mode, indicating LV systolic function within normal range
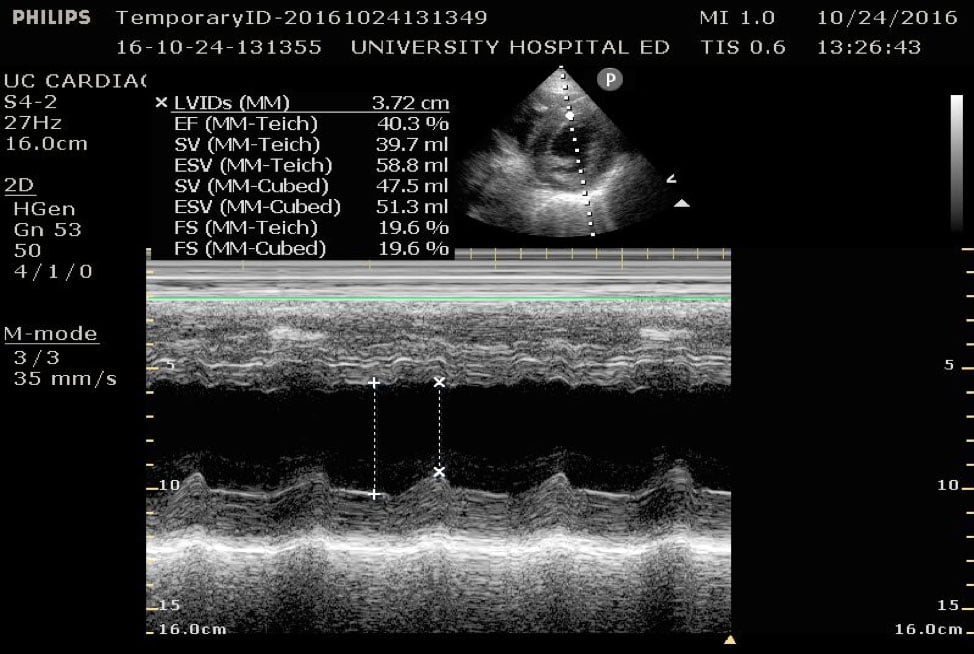
Figure 8. Parasternal short axis view at the mid-papillary level with fractional shortening measurement obtained using M-mode. Fractional shortening value of 19.6%, indicating hypodynamic LV systolic function.
Right ventricular strain
If an undifferentiated hypotensive patient is found to have right ventricular dilatation or strain, this points to an obstructive cause of shock such as pulmonary embolism. This can be detected by looking at right ventricular size, which is best assessed using side-by-side comparison of the LV and RV in the apical 4 chamber view. This can be roughly assessed qualitatively or by measuring the width of the RV and LV at a level 1cm above the tricuspid annulus (Figure 9). Under normal circumstances the RV should be <60% the size of the LV. A ratio of RV:LV greater than 1:1 can be suggestive of right ventricular strain or failure as cause of hypotension.
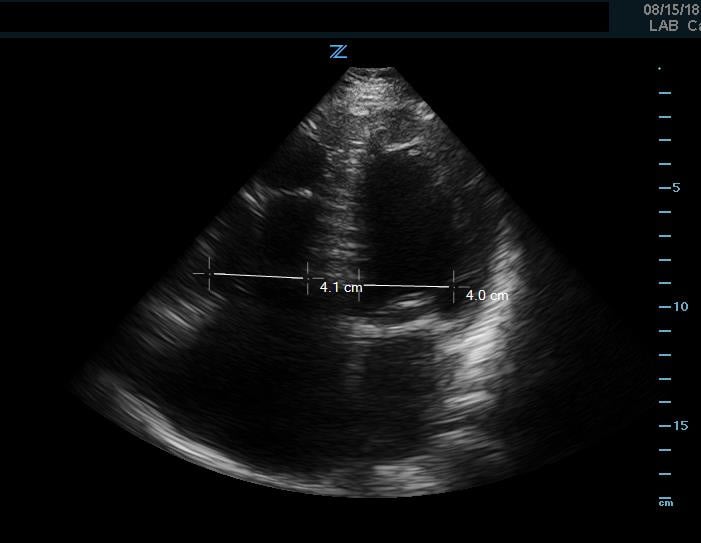
Figure 9. Apical 4 chamber view. Image of increased RV-LV ratio, approaching 1-1, indicative of severe RV strain.
In addition to comparison of chamber size, one can further quantify RV function by using Tricuspid Annular Plane Systolic Excursion (TAPSE). This measurement indicates RV systolic function. In the apical 4 chamber view, place an M mode line through the lateral aspect of the tricuspid annulus. Measure the distance the annulus travels during the ventricular cycle. A normal TAPSE is generally 20mm or greater. (Video 5) (Figure 10) A TAPSE less than 16mm is concerning for RV strain. (Figure 11)
Video 5. Apical 4 chamber view. Note movement of tricuspid annulus indicating visually normal TAPSE
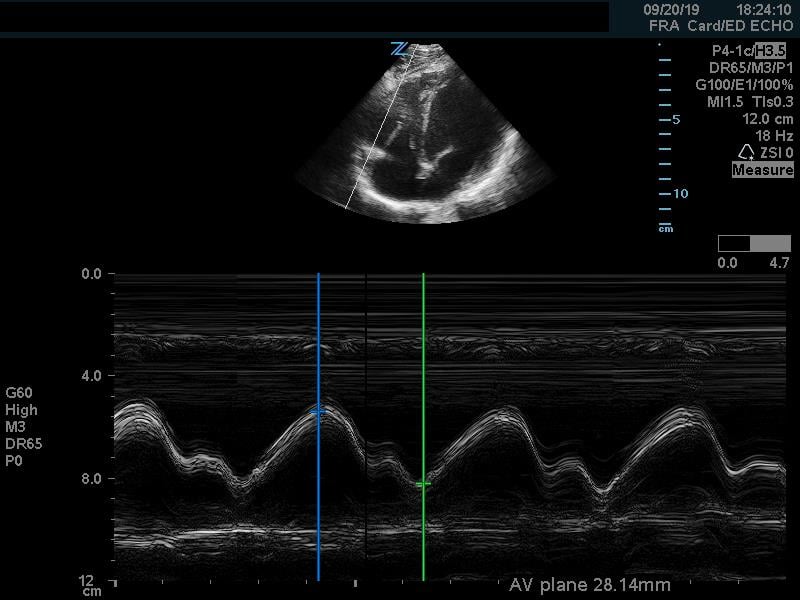
Figure 10. Apical 4 chamber view. M-Mode measurement of TAPSE measuring 28mm, indicating normal RV systolic function
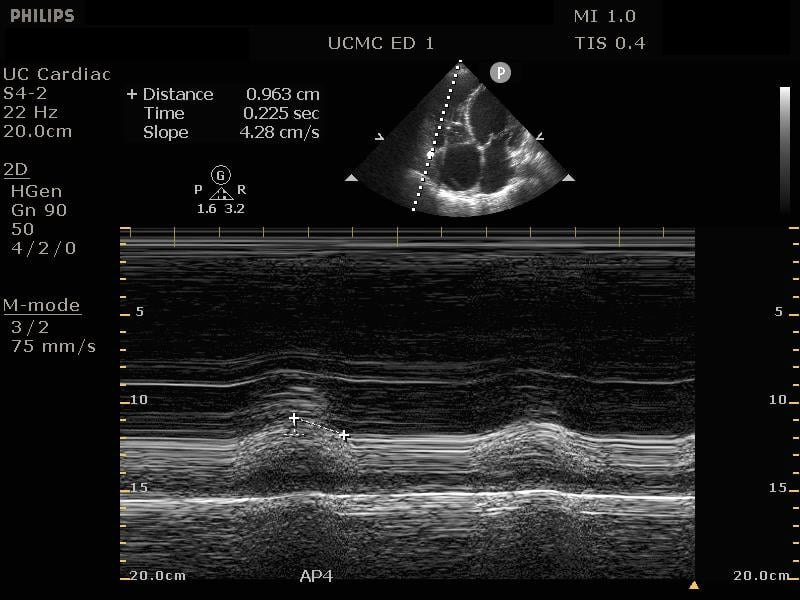
Figure 11. Apical 4 chamber view. M-Mode measurement of TAPSE measuring 9.6mm, indicating depressed RV systolic function
Under severe RV strain, a phenomenon known as McConnell’s sign may be present. Because the RV apex shares muscle fibers with the LV, it can appear to be hypercontractile when the remainder of the RV is hypokinetic, causing appearance of apical ‘winking.’ (Video 6)
Video 6. Apical 4 chamber view. Example of RV hypokinesis with apical sparing (McConnell’s sign). Note decreased TAPSE, visually
IVC
Echocardiography for Emergency Physicians (Sonoguide)
Obtaining information about the IVC may be helpful to provide information about the patient’s etiology of shock. Obstructive shock or cardiogenic shock will likely demonstrate an enlarged IVC with little variation in size while patients in hypovolemic shock will have a small and collapsible IVC. Two variables are often measured when measuring the IVC: IVC diameter and percentage of respiratory collapse with inspiration (in spontaneously breathing patients). These are measured in a longitudinal view of the IVC approximately 2cm from its junction with the right atrium. (Video 7 and 8)
Video 7. Image of large, plethoric IVC with minimal respiratory variation.
Video 8. Image of collapsible IVC with significant respiratory variation
Note that there are many variables which can affect IVC size and collapsibility and may lead to a false assessment of cause of hypotension when taken in isolation. It is important to integrate this information with the clinical picture as well as the remainder of US findings per the protocol to make an educated assessment of the underlying pathology.
Lung
Tension pneumothorax can cause rapid progression of hypoxia, hypotension and shock. While this is a commonly considered cause of shock in obvious trauma, it can also occur non-traumatically in ventilated patients, or in the setting of occult trauma. POCUS has sensitivity and specificity ranging from 90-100% for detecting pneumothorax.14-16
In order to maximize sensitivity, ultrasound can be performed at multiple intercostal levels; however, in the setting of shock and expected size of a hemodynamically significant pneumothorax, it is reasonable to limit this to a single anterior view of each lung field. This is performed in the 3rd-4th intercostal space of a supine patient in the midclavicular line, as it is performed in the EFAST examination for traumatic indications. The presence of lung sliding or z-lines (aka comet-tail artifact) or B-lines (discussed below) is highly specific for absence of pneumothorax. (Videos 9-11) Conversely, presence of a ‘lung point’ (Video 12) approaches 100% sensitivity and specificity for the presence of a pneumothorax. Lack of sliding is highly sensitive (~95%) for pneumothorax but can also be present in several other cases (mainstem intubation, apnea, ARDS, prior pleurodesis). Importantly, the test characteristics of lung ultrasound for the detection of pneumothorax in critically ill patients are not as good as when the study is done in stable patients.17
Video 9. Image of lung sliding. Note echogenic pleural line between rib shadows. “Shimmering” appearance indicates sliding of pleura
Video 10. Image of lung sliding, with z-lines. Z-lines are short bright projections that emanate from the pleural line.
Video 11. Image of pleura with absence of lung sliding. Note lack of shimmering or motion within bright echogenic pleural line
Video 12. Image of lung point. Note lung sliding is present on the right side of the image, with no lung sliding over the left side of the image=
In addition to obtaining views evaluating for pneumothorax, a slight change in depth/gain settings can provide additional information about the lung parenchyma. Particularly of interest in the setting of undifferentiated shock is the presence or absence of interstitial pulmonary edema, as this can be an indicator of a cardiogenic shock or fluid-overloaded state.
B lines are vertical lines which run from the pleura to the deep lung field. (Video 13) They are bright, echogenic, mobile ray-like projections which may coalesce. These are believed to be formed due to reverberation of sound waves from interstitial fluid. As such, the presence of multiple B lines can be an indicator of interstitial fluid such as from pulmonary edema, pneumonia, ARDS, etc. However, when B lines are ‘generalized,’ that is, present in multiple locations in bilateral lung fields, this is highly indicative of pulmonary edema.
Video 13. Image of B-lines. Note multiple deep, echogenic projections emanating from the pleural line
Abdomen
Focused Assessment with Sonography in Trauma (FAST)(Sonoguide)
Although the FAST exam was initially presented as an assessment tool for trauma, it has proven effective at determining presence of intraperitoneal fluid in multiple disease states. The RUQ, or Morison’s pouch view has been determined to be highly sensitive in detecting the presence of intraperitoneal fluid in amounts as small as 200mL.18 (Video 14) The overall sensitivity of the exam is also improved by obtaining LUQ and pelvic views, (Video 15) as well as extending the RUQ/LUQ views to include each respective hemithorax.
Video 14. Image of RUQ view with intraperitoneal free fluid present
Video 15. Image of Pelvic view with intraperitoneal free fluid present
When evaluating undifferentiated hypotension, these views are useful as they may indicate hemorrhagic causes of shock due to occult trauma, abdominal aortic aneurysm (AAA) rupture, ectopic pregnancy, etc., as well as indicate whether a fluid collection may be a potential focus of infection such as in spontaneous bacterial peritonitis.
Aorta
Abdominal Aortic Aneurysm (AAA)(Sonoguide)
Ultrasound is a valuable modality for determining presence of AAA. This is defined as an aortic diameter > 3cm. Though determination of ruptured AAA is difficult by ultrasound alone, RUSH and similar protocols rely on making a presumptive diagnosis of ruptured AAA as a cause of shock when the aortic diameter measures larger than 5cm while a normal aortic exam would make this diagnosis very unlikely. When performed as part of a rapid evaluation in a hypotensive patient, the most efficient location to visualize is the infrarenal aorta. (Video 16) (Figure 12)
Video 16. Image of abdominal aortic aneurysm in transverse view

Figure 12. Image of abdominal aortic aneurysm measurement. Note luminal thrombus present. Measurement should thus be taken from outside wall to outside wall
This exam should also evaluate for potential aortic dissection which would be indicated by the presence of an intimal flap on aortic views. Though POCUS is should not be relied on as it is poorly sensitive for dissection, specificity may be as high as 96%,19 meaning a positive finding could lead to significant changes in management in the critically ill patient. Presence of an intimal flap should prompt investigation of the aortic root as dilatation >3.8cm or presence of hemopericardium in this setting may indicate type A dissection and warrant emergent surgical management. (Video 17)
Video 17a,b. Image of aortic dissection. Image alternates from transverse (a) to longitudinal aortic views (b). Note hyperechoic flap adjacent to the anterior aortic wall.
DVT
Deep Vein Thrombosis (DVT)(Sonoguide)
ED physician performed compression ultrasound for DVT is highly accurate, with sensitivity and specificity of approximately 96% for diagnosis of DVT.20 If a DVT is visualized on ultrasound, the likelihood of a pulmonary embolism as a cause for hemodynamic instability is much higher. One study showed that a positive finding on a point of care DVT study increased the sensitivity for PE from 32% to 90% compared to echocardiography alone.21 The absence of a visualized DVT does not rule out a pulmonary embolism, however. (Videos 18,19)
Video 18. Image of Normal saphenofemoral junction. Note femoral artery on the right of the screen, femoral and saphenous veins on the left side of the screen. Ability to achieve complete compression of the veins excludes DVT at this level
Video 19. Image of DVT at proximal femoral vein. Note lack of complete compression in femoral vein. Similarly, echogenic material is visible within the vein, indicating a DVT at this level.
Putting it all together
The key aspect of the above protocols is integrating the information garnered from each of these individual exams to obtain a better view of the patient as a whole. A helpful way to categorize this information is by creating profiles of expected findings in each type of shock and comparing this information to the abnormal findings in the patient. Although the patient in question may not clearly fall into one of the categories based solely on ultrasound findings, the imaging findings can help the physician infer what therapies may be most beneficial to the patient. Furthermore, the use of serial examinations can allow for better quantification of response to treatment. As physiologic compensatory mechanisms may mask this response (or lack of response) initially, this may allow for earlier identification of response to therapy than monitoring of vital sign parameters alone. This allows the physician to better tailor therapy to the individual patient. Similarly, this knowledge can assist in avoiding therapies which may likely be detrimental to the patient (ie, aggressive fluid repletion in cardiogenic shock). (Figure 13)
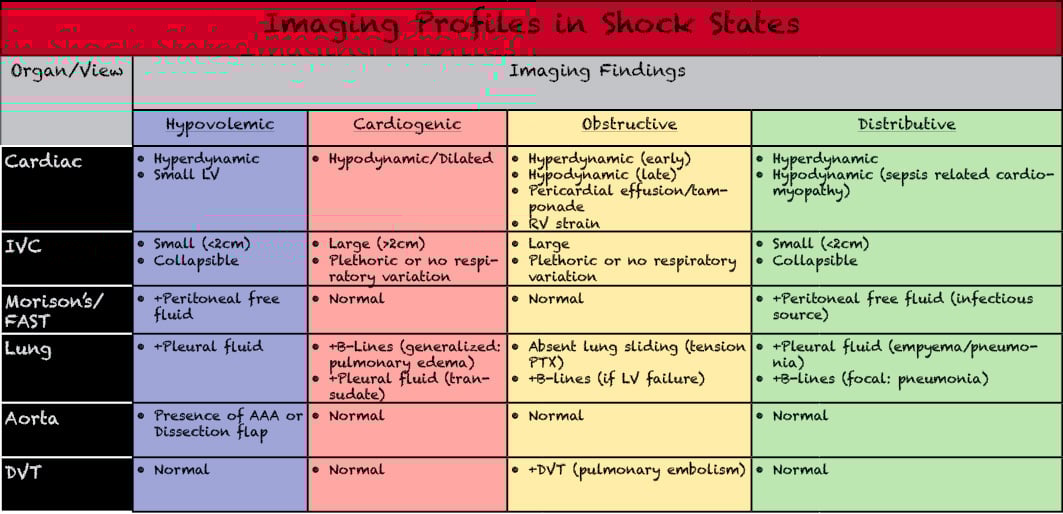
Figure 13. Varying forms of shock and differentiation of imaging findings which may be present in the hypotension evaluation exams. Adapted from Perera P, Mailhot T. Riley D, et al. The RUSH exam- rapid ultrasound in SHock in the evaluation of the critically lll. Emerg Med Clin North Am. 2010;28(1):29-56.
Below are cases which demonstrate the use of a hypotension protocol and the ultrasound findings in varying forms of shock.
Case 1
A 63yo M PMH HTN, HLD, DM, CAD, Afib on coumadin presents after being found down for unknown period of time. On arrival, patient is minimally responsive. Per his family, patient has suffered from several recent mechanical falls.
Vitals
HR: 120
BP: 70/40
SpO2: 96% NRB
RR: 14
Temp: 97.2F
Videos 20 A) PLAX cardiac view indicating hyperdynamic function. B) Flat, collapsible IVC with significant respiratory variation. C) Positive RUQ peritoneal view indicating free peritoneal fluid
These images would indicate potentially an abdominal source of blood loss, which would classify this patient’s shock state as hypovolemic in nature.
Case 2
A 54yoM PMH HTN, HLD, CAD presents with shortness of breath, chest pain and cough x 1 week, now worsened. Per family patient is ‘not acting right’ today which is what prompted a visit to the ED. Family is not sure if patient has had fevers, although he often has been sweating at night. On arrival patient is agitated and confused, pulling off his oxygen mask and swatting at providers.
Vitals
HR 94
BP: 80/60
Spo2: 76%RA
RR: 22
Temp: 96.4F
Videos 21 A) PLAX cardiac view indicating severely hypodynamic function. B) Large, plethoric IVC without respiratory variation. C) B-lines present in the lung field indicating interstitial fluid
These images would indicate likely fluid overload secondary to heart failure, classifying the shock as likely cardiogenic in nature.
Case 3
Patient is a 63yo F PMH HTN, HLD, DM, Dementia who presents from nursing facility for altered mental status. Per nursing staff patient has been more lethargic recently, and today was noted to be more confused than usual. They report a chronic cough which is worsened, as well as several episodes of non-bloody, nonbilious vomiting yesterday. No documented fevers at nursing facility. On arrival, patient is lethargic but arouses to painful stimuli.
Vitals
HR 110
BP 60/40
SpO2 88% 4L NC
RR: 20
Temp: 95.1F
Videos 22 A) PSAX cardiac view indicating hyperdynamic function. B) Flat, collapsible IVC with significant respiratory variation. C) Extended RUQ view showing the R hemithorax with complex effusion present
These images would indicate a distributive form of shock, likely septic shock given complex lung effusion, concerning for empyema.
Case 4
A 64yoF PMH DM, HTN, HLD, CAD with prior CABG presents for chest pain and shortness of breath for the past 4 hours. Pt reports she had onset of pressure-like, substernal chest pain while she was gardening. It has continued to increase in severity and is now associated with shortness of breath. Her symptoms have been worse with exertion. Not improved with ASA and NTG at home. Mild nausea without vomiting. She has a dry cough associated with her symptoms. Unsure if she has had fevers.
Vitals
HR: 120
BP: 90/40
Spo2: 94% RA
RR: 18
Temp: 100.3F
Videos 23 A) PSAX cardiac view indicating hyperdynamic function and large RV. B) Apical 4 chamber view confirming RV-LV ratio > 1. C) Large, plethoric IVC. D) Non-compressibility of femoral vein indicating +DVT
These images would indicate likely venous thromboembolism now causing obstructive shock
Pearls and Pitfalls
- Multiple POCUS hypotension protocols exist. How comprehensive a protocol is used will likely depend on stability of the patient, time available and clinical suspicion.
- In a critically ill patient, it may be appropriate to use a tiered approach such as the SHoC protocol which prioritizes certain views based on overall disease prevalence.
- Use of a POCUS protocol can identify a cause of shock which would be otherwise unsuspected (for example: sepsis related cardiomyopathy)22
- The use of a POCUS protocol in the setting of undifferentiated shock is likely to improve diagnostic accuracy and thus alter initial management.
- It is extremely important to take the overall clinical context into account when interpreting images from a POCUS hypotension protocol. Relying too heavily on findings from a single aspect of the exam or making interpretations despite conflicting data can result in inappropriate diagnosis.
- Even a seemingly unremarkable exam can provide valuable information about physiology in the critically ill individual in helping to exclude specific diagnoses or better classify a particular form of shock.
- It is useful to perform serial examinations, as the patient’s clinical status as well as ultrasound findings may change in response to disease course or in response to treatment.
References
- Rivers E, Nguyen B, Havstad S, et al. Early goal-directed therapy in the treatment of severe sepsis and septic shock. N Engl J Med. 2001;345(19):1368-77.
- Sebat F, Musthafa AA, Johnson D, et al. Effect of a rapid response system for patients in shock on time to treatment and mortality during 5 years. Crit Care Med. 2007;35(11):2568-75.
- Weingart SD, Duque D, Nelson B. Rapid ultrasound for shock and hypotension. (RUSH-HI-MAP), 2009. http://emedhome.com/
- Perera P, Mailhot T, Riley D, et al. The RUSH exam: Rapid Ultrasound in SHock in the evaluation of the critically ill. Emerg Med Clin North Am. 2010;28(1):29-56.
- Atkinson PR, McAuley DJ, Kendall RJ, et al. Abdominal and Cardiac Evaluation with Sonography in Shock (ACES): an approach by emergency physicians for the use of ultrasound in patients with undifferentiated hypotension. Emerg Med J. 2009;26(2):87-91.
- Atkinson P, Bowra J, Milne J, et al. International Federation for Emergency Medicine Consensus Statement: Sonography in hypotension and cardiac arrest (SHoC): An international consensus on the use of point of care ultrasound for undifferentiated hypotension and during cardiac arrest. CJEM. 2017;19(6):459-470.
- Jones AE, Tayal VS, Sullivan DM, et al. Randomized, controlled trial of immediate versus delayed goal-directed ultrasound to identify the cause of nontraumatic hypotension in emergency department patients. Crit Care Med. 2004;32(8):1703-8.
- Sasmaz MI, Gungor F, Guven R, et al. Effect of focused bedside ultrasonography in hypotensive patients on the clinical decision of emergency physicians. Emerg Med Int. 2017; 2017:6248687. doi: 10.1155/2017/6248687. Epub 2017 Mar 5.
- Shokoohi H, Boniface KS, Pourmand A, et al. Bedside ultrasound reduces diagnostic uncertainty and guides resuscitation in patients with undifferentiated hypotension. Crit Care Med. 2015;43(12):2562-9.
- Volpicelli G, Lamorte A, Tullio M, et al. Point-of-care multiorgan ultrasonography for the evaluation of undifferentiated hypotension in the emergency department. Intensive Care Med. 2013;39(7):1290-8.
- Atkinson PR, Milne J, Diegelmann L, et al. Does point-of-care ultrasonography improve clinical outcomes in emergency patients with undifferentiated hypotension? An International Randomized Controlled Trial From the SHoC-ED Investigators. Ann Emerg Med. 2018;72(4):478-89.
- Ünlüer EE, Karagöz A, Akoğlu H, et al. Visual estimation of bedside echocardiographic ejection fraction by emergency physicians. West J Emerg Med. 2014;15(2):221-6.
- Lang RM, Bierig M, Devereux RB, et al. Recommendations for chamber quantification. Eur J Echocardiogr. 2006;7(2):79-108.
- Lichtenstein DA, Menu Y. A bedside ultrasound sign ruling out pneumothorax in the critically ill. Lung sliding. Chest. 1995;108(5):1345-8.
- Lichtenstein D, Mezière G, Biderman P, et al. 2000. The “lung point”: an ultrasound sign specific to pneumothorax. Intensive Care Med. 2000;26(10):1434-40.
- Wilkerson RG, Stone MB. Sensitivity of bedside ultrasound and supine anteroposterior chest radiographs for the identification of pneumothorax after blunt trauma. Acad Emerg Med. 2010;17(1):11-7.
- Lichtenstein DA. Lung ultrasound in the critically ill. Ann Intensive Care. 2014;4(1):1.
- American Institute of Ultrasound in Medicine, American College of Emergency Physicians. AIUM practice guideline for the performance of the focused assessment with sonography for trauma (FAST) examination. J Ultrasound Med. 2014;33(11):2047-56.
- Ranasinghe AM, Strong D, Boland B, et al. Acute aortic dissection. BMJ. 2011;343: doi: 10.1136/bmj.d4487.
- Pomero F, Dentali F, Borretta V, et al. Accuracy of emergency physician-performed ultrasonography in the diagnosis of deep-vein thrombosis: a systematic review and meta-analysis. Thromb Haemost. 2013;109(1):137-45.
- Nazerian P, Vanni S, Volpicelli G, et al. Accuracy of point-of-care multiorgan ultrasonography for the diagnosis of pulmonary embolism. Ches 2014;145(5):950-7.
- Kanji HD, McCallum J, Sirounis D, et al. Limited echocardiography-guided therapy in subacute shock is associated with change in management and improved outcomes. J Crit Care. 2014;29(5):700-5.
--- Advertisement ---