Fellows’ Section: Diastology at the Bedside
Case:
A 60-year-old female with a history of hypertension and COPD presents to the emergency department with shortness of breath and cough. She also complains of gradually worsening leg swelling over several months. She is afebrile and her vital signs are remarkable for a blood pressure of 210/100 mmHg, a respiratory rate of 35, and an oxygen saturation of 85% on room air. On examination, she is tachypneic with diffuse expiratory wheezing with 3+ pitting edema to her bilateral lower extremities. You place the patient on non-invasive ventilation and perform an ultrasound of her lungs which shows diffuse B-lines bilaterally. Your point-of-care ultrasound (POCUS) of the heart shows normal systolic function. You suspect that this patient is not having a COPD exacerbation, but instead may be suffering from new decompensated diastolic heart failure. What findings on ultrasound would confirm your suspicion?
Heart failure affects 5.7 million Americans and the prevalence is expected to increase to 8 million by 2030.1,2 Almost half of all patients with heart failure have diastolic dysfunction, or heart failure with preserved ejection fraction (HFpEF), which has been associated with an increase in all-cause mortality.3,4 While several studies have shown that emergency physicians can estimate systolic ejection fraction with high accuracy, there is less data to support the same for diastolic function.5-7 However, given the prevalence of HFpEF, emergency physicians will inevitably be tasked to diagnose and treat patients with diastolic heart failure. Understanding how to identify diastolic dysfunction on POCUS can avoid misdiagnosis and errors in treatment.
Diastolic Physiology
Diastolic dysfunction is characterized by impaired relaxation and non-compliance of the left ventricle (LV), usually secondary to long-standing hypertension. During systole, concentric fibers squeeze the LV in a twisting motion analogous to the motion of wringing out a wet towel. During normal diastole, the LV actively uncorks and untwists. Contrary to the term “passive filling,” diastole is actually an energy-consuming process requiring ATP. This untwisting creates a drop in LV pressure, which then opens the mitral valve, and allows blood to be sucked in from the left atrium (LA) to the LV. However, with diastolic dysfunction, the heart fails to relax properly, and over time, it becomes stiff and non-compliant, which causes an elevation in LV pressures, LA pressures, and LA dilatation. When the mitral valve opens, the elevated LA pressure pushes blood into the LV. In diastolic dysfunction, blood is no longer being sucked in, but is instead being pushed in by elevated LA pressure.
Given that the pathophysiology of diastolic dysfunction is associated with long-standing hypertension and increased LA pressures, the presence of LV hypertrophy and a dilated LA can quickly give you a sense of the likelihood of diastolic dysfunction. On a parasternal long axis view of the heart, the AP diameter of the LA should be approximately equal to that of the aortic root and the right ventricle. A grossly enlarged diameter just from visual estimation, as well as an AP LA diameter measurement >4cm, suggests LA dilatation. LV hypertrophy can also be visually identified and measured as a posterior diastolic LV wall thickness >1.2 cm in women and >1.3 cm in men.8 These findings increase the likelihood that diastolic dysfunction is present.
Obtaining Diastolic Measurements
Measurements of diastolic function are obtained using Spectral Doppler to measure blood and tissue velocities. Pulsed wave Doppler uses the Doppler effect to allow assessment of both blood and tissue velocity and direction. The sample gate of the pulsed wave Doppler is placed between the tips of the mitral valve leaflets to measure blood velocity. (Figure 1) In addition to pulsed wave Doppler, tissue Doppler imaging setting is used to measure tissue velocity, and to determine the compliance of LV tissue during diastole. Tissue Doppler imaging filters out higher velocity signals to improve imaging of lower tissue velocities. With Tissue Doppler, the sample gate is placed in either of two locations: at the septal mitral annulus or at the lateral mitral annulus. (Figure 2) All measurements are performed on the apical four chamber view.
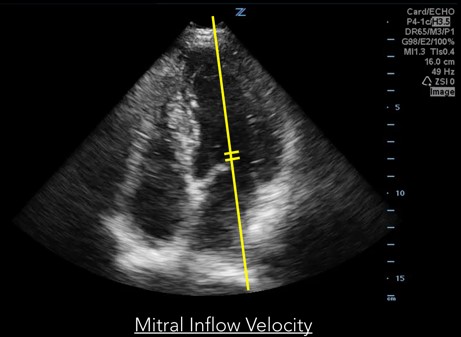
Fig 1. Mitral inflow velocity
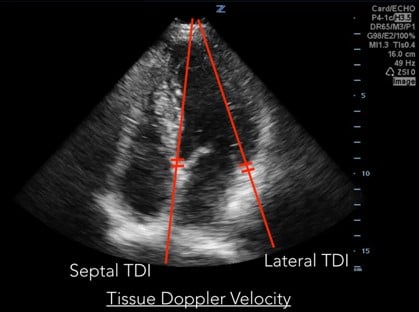
Fig 2. Tissue Doppler Velocity
An optimized apical four chamber view is the key to obtaining accurate diastolic measurements. The septum should ideally be oriented vertically and no more than 20 degrees off axis. Placing the patient in left lateral decubitus can greatly improve image quality. Increasing the steepness of the probe angle away from the skin will transform an apical five chamber view into the desired four chamber view. In addition, it is important to know that diastolic measurements will be inaccurate in patients with atrial fibrillation, mitral annular calcification or severe regurgitation, ventricular assist devices, pacemakers, and tachycardia over 100 beats per minute.
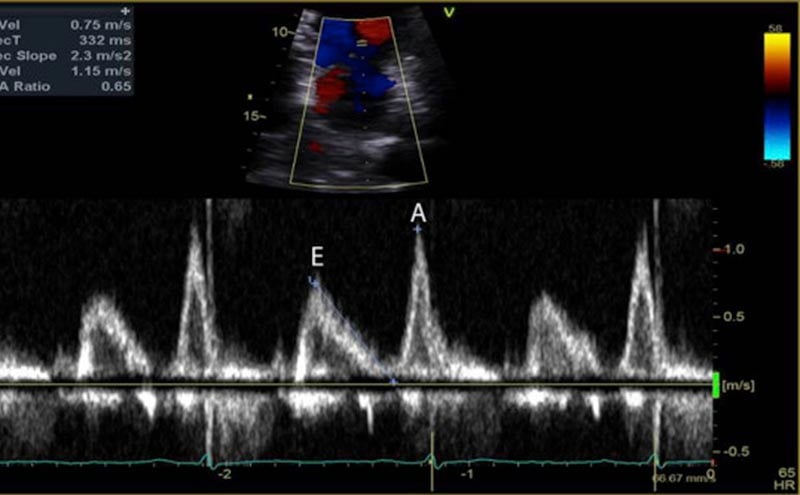
The mitral inflow velocity tracing produces a graph of velocity over time. (Figure 3) The two upward deflections occur during diastole and are known as the E wave (for “early” diastole during which passive filling occurs across a pressure gradient) and the A wave (for “atrial” contraction), and the downward deflection occurs during systole. The tissue doppler tracing produces a similar graph but the two downward deflections occur during diastole and upward deflections occur during systole. (Figure 4) These two downward tissue doppler deflections are known as the e’ wave and the a’ wave.
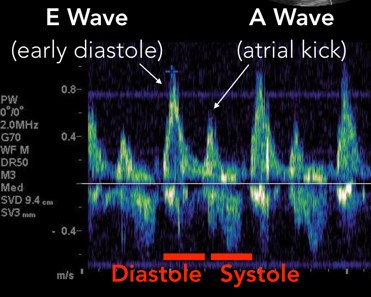
Fig 3. Mitral Inflow Velocity Tracing
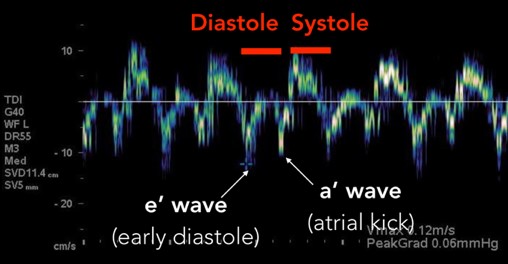
Fig 4. Tissue Doppler Velocity Tracing
The 2016 American Society of Echocardiography guidelines outline four abnormal variables in the diagnosis of diastolic dysfunction: Mitral annulus e’ velocity (septal e’<7cm/sec, lateral e’<10cm/sec), average E/e’>14, LA maximum volume index >34 mL/m2 which is indexed to Body Surface Area, and peak tricuspid regurgitant velocity >2.8 m/sec.9 The LA volume index and the peak tricuspid regurgitant velocity are two variables that are more difficult and time consuming to obtain and therefore less likely to be practically applied in emergency department patients.
Anatomy of Mitral Inflow Velocity Tracing
1. Isovolumetric Relaxation: The first part of diastole occurs when the LV relaxes and untwists, which drops LV pressures and creates a pressure gradient. This period where the LV relaxes prior to the mitral valve opening is called “isovolumetric relaxation.” It is seen on the tracing as a biphasic spike as there is no net movement of blood. (Figure 5)
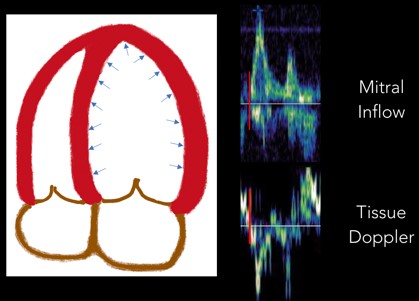
Fig 5. Isovolumetric Relaxation
2. E Wave: Next, the E wave is created when the mitral valve opens and blood flows down a pressure gradient (Figure 6). In normal diastole, this pressure gradient is generated by a suction effect from an LV that is compliant and able to relax effectively. In diastolic dysfunction this pressure is generated by abnormally elevated LA pressures
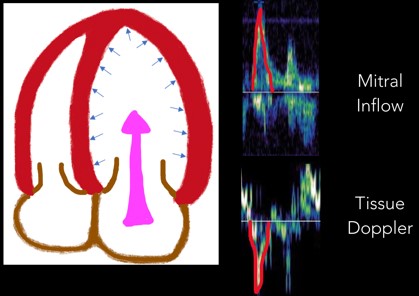
Fig 6. E Wave
3. Diastasis: Diastasis occurs once LA and LV pressures equilibrate. (Figure 7)
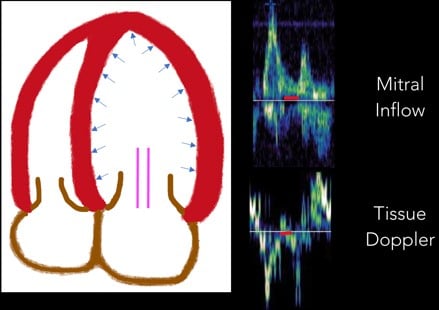
Fig 7. Diastasis
4. A Wave: Near the end of diastole, the atrial contraction creates the A wave. (Figure 8)
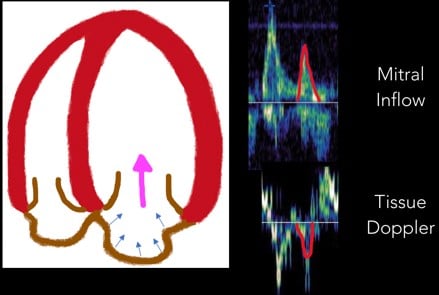
Fig 8. A Wave
5. Isovolumetric Contraction: With the start of systole, the LV contracts prior to the aortic valve opening. This period of time is called “isovolumetric contraction” and is represented by another biphasic spike. (Figure 9)
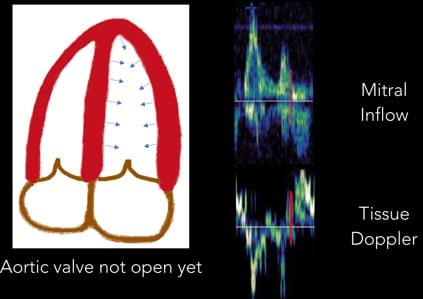
Fig 9. Isovolumetric Contraction
6. Systolic Wave: Once the aortic valve opens, the systolic wave is generated. (Figure 10)
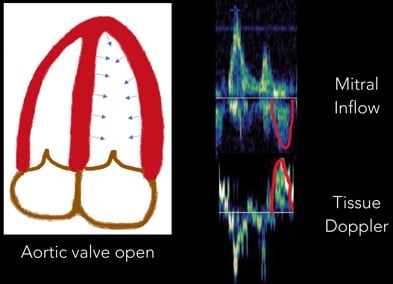
Fig 10. Systolic Wave
Normal Diastolic Function
In normal diastole, the mitral inflow E wave is greater than the A wave. The majority of blood flows in through a pressure gradient and only a small percentage is pushed in by the atrial contraction, hence E>A. The Tissue Doppler septal e’ is >7 cm/sec, and the lateral e’ is >10 cm/sec. The septal e’ is generally a lower velocity than the lateral e’ since it is tethered to the septum and the right ventricle. In addition, the average E/e’ ratio (averaged from the septal and lateral e’), is a surrogate for pulmonary capillary wedge pressure. Normally, E/e’ is <10, indicating that there is no elevation in LA pressures.
Grade I (mild) Diastolic Dysfunction
During the first stage of diastolic dysfunction, the heart has impaired relaxation. The LV is like a broken vacuum. When the mitral valve opens, there is a loss of suction power that is generated from the LV in normal diastole. As a result, less blood flows in during passive filling (E wave) which causes the E wave to become smaller. More blood is pushed through the atrial contraction (A wave), which causes the A wave to become larger. Therefore, in Grade I (mild) diastolic dysfunction, there is E and A reversal, where E<A. During this early stage of dysfunction, the LV is not yet non-compliant and therefore tissue doppler values are normal. LA pressures are also not elevated and therefore E/e’ is still <10.
Grade II (moderate) Diastolic Dysfunction
Grade II (moderate) diastolic dysfunction is characterized by LV non-compliance resulting in elevated LA pressures. When the mitral valve opens, the elevation in LA pressures re-establishes a large gradient through which blood is pushed from the LA into the LV, thus resulting in E being greater than A again. If E>A, how can we differentiate between normal and Grade II diastolic dysfunction? Unlike with normal diastole, grade II dysfunction will have abnormal tissue doppler velocities. If septal e’<7cm/sec or lateral e’<10cm/sec, and E/e’ is between 10-14, then the patient most likely has grade II diastolic dysfunction.
Grade III (severe) Diastolic Dysfunction
In Grade III (severe) diastolic dysfunction, LA pressures are significantly elevated. When the mitral valve opens, the difference between LA and LV pressures is so great that diastasis is reached very quickly with little contribution of blood flow from the atrial contraction. The E wave is at least twice the size of the A wave. Tissue doppler velocities will be low, and E/e’ will be >14. Of note is that healthy patients under age 40 may have mitral inflow velocities where E is twice the size of A due to the ability of a normal heart to relax and cause suctioning of blood into the LV at high velocities. However, these patients with normal diastolic function should lack signs of elevated LA pressures and have normal LA size, as well as normal tissue doppler velocities and E/e’ ratio.
A summary of the mitral inflow and Tissue Doppler velocities with normal and abnormal values is seen in Figure 11.
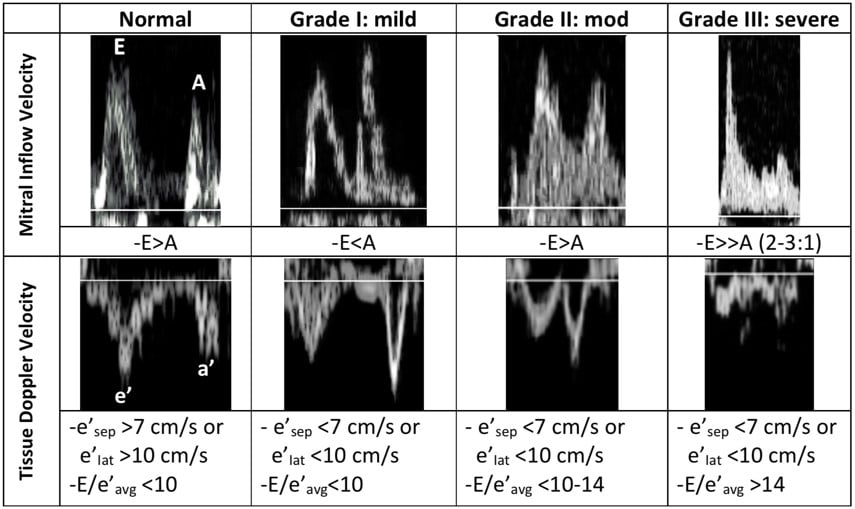
Figure 11. Summary of diastolic measurements
Diastolic Dysfunction in the Emergency Department
While a patient may have echocardiographic measurements of diastolic dysfunction, this does not necessarily mean the patient has diastolic heart failure. The diagnosis of heart failure is dependent on symptoms as defined by the NY Heart Association Classification Class. Patients with heart failure can have heart failure with preserved EF (HFpEF), or heart failure with reduced EF (HFrEF). In general, a patient with elevated LA pressures (Grade I or II diastolic dysfunction) is likely to be symptomatic at least with exertion, while a patient with Grade I diastolic dysfunction can be asymptomatic. Symptoms of chronic diastolic heart failure can be controlled with medications and dietary restrictions.
Patients that present to the emergency department with acute decompensated diastolic heart failure can be sorted into two main categories: those with acute on chronic diastolic dysfunction and those with an acute insult causing new diastolic dysfunction.
Patients with acute on chronic diastolic dysfunction are managed similarly to patients with systolic heart failure, with non-invasive ventilation, nitroglycerin, and diuresis. Strategies aimed at treating diastolic dysfunction include rate control and return to sinus rhythm, as patients with abnormal LV compliance are dependent on a lower heart rate to maintain adequate end diastolic filling and stroke volume. In patients with diastolic heart failure, medications such as milrinone and a calcium-sensitizer levosimendan have been shown to improve diastolic measurements, although have not been shown to affect mortality.10
Patients may present with a new acute insult causing diastolic dysfunction include, most commonly, acute myocardial infarction and sepsis. As mentioned earlier, diastole is an energy consuming process requiring ATP. It is therefore not surprising that ischemia of myocardial cells will affect both systolic and diastolic function. Interestingly, a study by Labovits et al. found that when the coronary arteries were transiently occluded with angioplasty, diastolic dysfunction was the first abnormality that occurred, followed by electrocardiogram changes, and then by systolic dysfunction.11 The timing of diastolic dysfunction being the earliest marker of myocardial ischemia may prove useful in future studies identifying higher risk patients with non-ST elevation myocardial infarction who may benefit from earlier revascularization.
Diastolic dysfunction is also common in sepsis. In fact, it is more common than systolic dysfunction. Among patients with severe sepsis or septic shock, 38% were found to have isolated diastolic dysfunction, while only 9% had isolated systolic dysfunction, and 14% had both.12 Many mediators within the pathophysiology of sepsis can cause diastolic dysfunction, and include the release of cytokines, impaired coronary microcirculation, and high nitric oxide concentrations.13 Diastolic dysfunction is also an independent predictor of mortality in patients with sepsis and septic shock. Patients with lower e’ values and higher E/e’ values have worsened survival rates.12
There is also more recent data showing that patients with severe sepsis or septic shock have higher mortality when they are over-resuscitated and have a positive fluid balance.14 The reasoning is that over-resuscitation causes pulmonary edema and venous congestion in organs such as the kidneys which later results in organ failure.15
Putting It All Together at the Bedside
We know that diastolic dysfunction is common in patients with sepsis and associated with increased mortality, that over-resuscitation is also associated with worsened mortality, and that patients with diastolic dysfunction are less able to tolerate fluids given increased LA pressures. Is diastolic dysfunction one of the reasons why these patients do worse? Can we use diastology to identify patients who are at higher risk of being harmed by fluids?
One advantage of diastolic measurements is that it is responsive to fluid administration and diuresis. Even performing a Valsalva maneuver can improve Grade II into Grade I morphology, and is an additional way to differentiate normal from Grade II diastolic dysfunction. Tissue doppler velocities and the E/e’ ratio are generally more load independent measurements.9
In a septic hypotensive patient who may or may not have a history of diastolic dysfunction, giving a fluid challenge and then evaluating whether this fluid challenge increases LA pressures through diastolic measurements may be one way to tell if a patient is fluid tolerant or intolerant. Adding lung ultrasound to diastolic measurements to look for B-lines would be a helpful adjunct, as B-lines appear even prior to symptoms of dyspnea.16 If the fluid bolus causes a patient to move from Grade II to Grade III diastolic dysfunction as evidenced by an increasing E wave velocity and increasing E/e’ ratio, continued fluid resuscitation may cause more pulmonary edema and venous congestion. This diastolic data in conjunction with focused echocardiography, lung ultrasound, patient clinical appearance and vital signs may be useful in determining which patients would be at higher risk for injury with further fluid administration.
The potential impact of using diastolic measurements in the ED on patient outcomes is still unknown. However, as new medications targeting diastolic dysfunction emerge and fluid administration strategies are refined, the assessment of diastolic function in patient care may become increasingly necessary. At the very least, understanding diastolic measurements can aid in the diagnosis of new onset diastolic dysfunction and may help identify patients at higher risk for harm from excess fluid dispensation.
References
- Mozaffarian D, Benjamin EJ, Go AS, et al. Heart disease and stroke statistics--2016 update: a report from the American Heart Association. Circulation. 2015;133:e38-e360.
- Savarese G, Lund LH. Global public health burden of heart failure. Cardiac Failure Review. 2017;3:7-11.
- Redfield MM, Jacobsen SJ, Burnett JC, et al. Burden of systolic and diastolic ventricular dysfunction in the community: appreciating the scope of the heart failure epidemic. JAMA. 2003;289:194-202.
- Halley CM, Houghtaling PL, Khalil MK, et al. Mortality rate in patients with diastolic dysfunction and normal systolic function. Arch Intern Med. 2011;171:1082-7.
- Moore CL, Rose GA, Tayal VS, et al. Determination of left ventricular function by emergency physicians echocardiography of hypotensive patients. Acad Emerg Med. 2002;8:186-93.
- Randazzo MR, Snoey ER, Levitt A, et al. Accuracy of emergency physician assessment of left ventricular ejection fraction and central venous pressure using echocardiography. Acad Emerg Med. 2003;10:973-7.
- Ehrman RR, Russell FM, Ansari AH, et al. Can emergency physicians diagnose and correctly classify diastolic dysfunction using bedside echocardiography? Am J Emerg Med. 2015;117:1178-83.
- Lang RM, Bierig M, Devereux RB, et al. Recommendations for cardiac chamber quantification: a report from the American Society of Echocardiography’s Guidelines and Standards Committee and the Chamber Quantification Writing Group, developed in conjunction with the European Association of Echocardiography, a branch of the European Society of Cardiology. J Am Soc Echocardiogr. 2005;18:1440-63.
- Nagueh SF, Smiseth OA, Appleton CP, et al. Recommendations for the evaluation of left ventricular diastolic dysfunction by echocardiography: an updated from the American Society of Echocardiography and the European Association of Cardiovascular Imaging. J Am Soc Echocardiogr. 2016;29:277-314.
- Godfrey GEP, Peck M. Diastolic dysfunction in anaesthesia and critical care. BJA Education. 2016;16:287-91.
- Labovitz AJ, Lewen MK, Kern M, et al. Evaluation of left ventricular systolic and diastolic dysfunction during transient myocardial ischemia produced by angioplasty. JACC. 1987;10:748-55.
- Landesburg G, Gilon D, Meroz Y, et al. Diastolic dysfunction and mortality in severe sepsis and septic shock. Euro Heart J. 2012;33:895-903.
- Merx MW, Weber C. Sepsis and the heart. Circulation. 2007;116:793-802.
- Malbrain ML, Marik PE, Witters I, et al. Fluid overload, de-resuscitation, and outcomes in critically ill or injured patients: a systematic review with suggestions for clinical practice. Anesthesiology Intensive Therapy. 2014;46:361-80.
- Malbrain ML, Van Regenmortel N, Saugel B, et al. Principles of fluid management and stewardship in septic shock: it is time to consider the four D’s and the four phases of fluid therapy. Ann Intensive Care. 2018;22:66.
- Agricola E, Bove T, Oppizzi M, et al. Ultrasound comet-tail images: a marker of pulmonary edema: a comparative study with wedge pressure and extravascular water. Chest. 2005;127:1690-5.
Judy Lin, MD, FACEP and Samantha Chin, MD
Maimonides Medical Center, Brooklyn, NY