Advanced Echo Pocket Card Series #2: Diastolic Dysfunction
Natalie Truong, MD, Loma Linda University Medical Center
Zan Jafry, MD, FACEP, Loma Linda University Medical Center
Lindsay Taylor, MD, FACEP, Virginia Commonwealth University
Case Presentation
69-year old male with history of hypertension, diabetes, squamous cell carcinoma of larynx status post chemotherapy, radiation, total laryngectomy, tracheostomy dependence, and status post renal transplant developed progressively worsening shortness of breath with increased sputum production over 3 days.
On arrival, the patient’s vital signs include temperature of 97.8°F, BP 124/60 mm Hg, HR 77 bpm, RR 30 bpm, and SpO2 77% on room air. On examination, the patient appeared in moderate respiratory distress with thick sputum from tracheostomy site. Patient was placed on a trach mask 10 liters and given Mucomyst and DuoNeb inhalation without any improvement. Next, patient underwent a fiberoptic tracheostomy tube replacement. He was placed on the ventilator with tidal volume of 350 ml with improvement in SpO2 89%.
Initial workup significant for WBC 17, Na 124, K 5.3, HCO3 17, BUN 43, Cr 1.8, glucose 370, and normal lactate. Arterial blood gas revealed pH 7.24, PaO2 46, PaCO2 44, FiO2 100%. Respiratory viral panel was negative. Chest x-ray revealed patchy bilateral lung airspace disease with possible pleural effusions.
A point-of-care ultrasound was performed to further evaluate his dyspnea. The cardiac ultrasound showed moderately depressed left ventricular ejection fraction, left atrial enlargement, mitral annulus calcification, grade 2 diastolic dysfunction and apical and inferoseptal hypokinesis. The lung ultrasound showed diffuse B-lines.
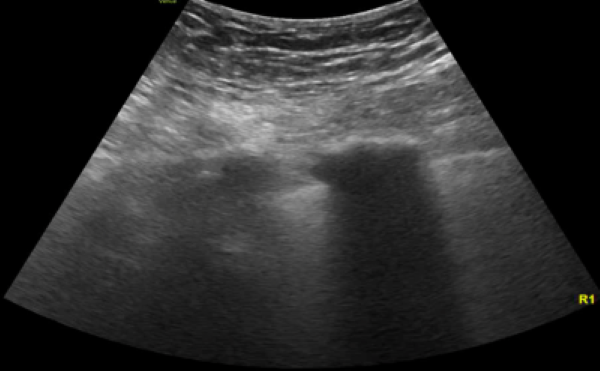
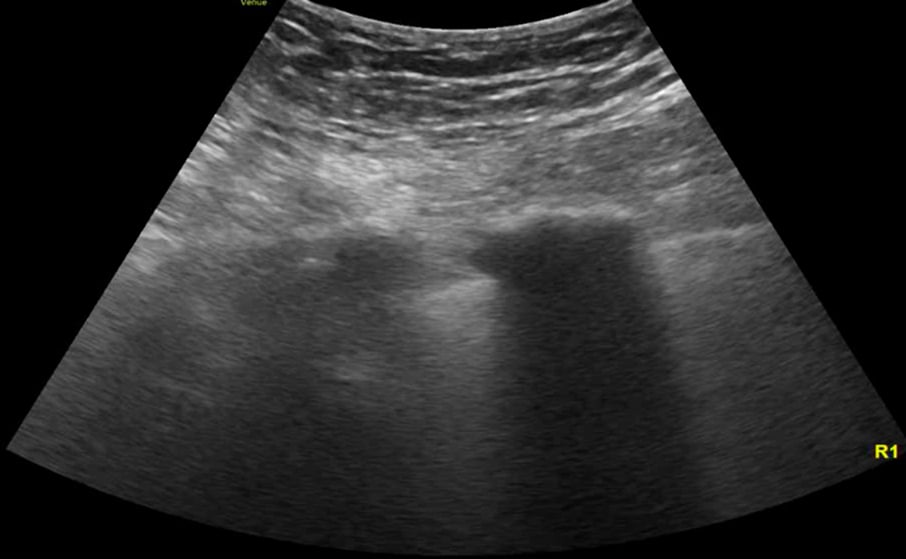
Image 1. Lung ultrasound shows diffuse B lines.
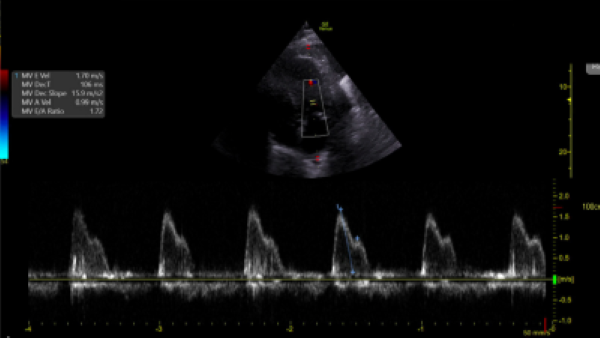
Image 2. Pulsed-Wave Doppler of mitral inflow pattern reveals mitral E velocity 1.70 m/s and E/A 1.72.
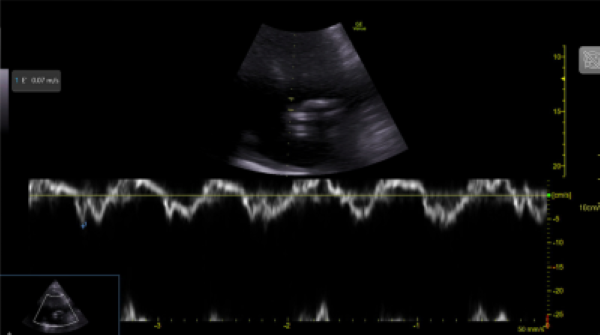
Image 3. Tissue Doppler Imaging shows mitral annular e’ velocity 7 cm/s. Mitral inflow shows pseudonormal LV filling pattern consistent with elevated LV filling pressures and classified as grade 2 diastolic dysfunction.
Background
Acute hypoxemic respiratory failure is a common diagnosis in the emergency department. Acute respiratory distress syndrome (ARDS) is a subgroup of respiratory failure which is characterized by diffuse inflammatory lung injury of the alveoli and pulmonary circulation. Furthermore, when ARDS progresses to moderate and severe stages, this can lead to an increase in RV afterload resulting in acute cor pulmonale as early as in the first 3 days with a prevalence of 22%.1 Based on a regression analysis, patients with risk factors of pneumonia as a cause of ARDS, driving pressure ≥18 cm H2O, PaO2/FiO2 ratio < 150 mmHg, and PaCO2 ≥ 48 mmHg have an approximately 60% risk of developing acute cor pulmonale and should be assessed with ultrasonography to help guide ventilator management to decrease RV afterload.1,2
Ultrasound offers the benefit of earlier recognition of possible causes of respiratory failure. Lung ultrasonography is initially utilized to help identify the presence of lung and pleural abnormalities. For instance, the distribution of B lines are generally nonuniform in ARDS compared to diffuse pattern in cardiogenic pulmonary edema but is not definitive to distinguish them from one another.
Recent studies have shown that ARDS patients with left ventricular diastolic function has a significant increase in extravascular lung water detected by lung ultrasound, however, it is only a qualitative not a quantitative measure.3 Conventionally, the most accurate way of measuring the LV filling pressure which correlates with the mean PCWP is through an invasive procedure using the pulmonary artery catheter, but modern practice and clinical trials have shown that it is rarely used in critically ill patients.4 By contrast, real time echocardiography can be used as an alternative method. Specifically, diastology can be used as a quantitative assessment of left ventricular preload to differentiate cardiogenic from noncardiogenic pulmonary edema. In general, LV preload is determined by LV relaxation and compliance. LA pressure is a dynamic variable and can be changed by preload that affects the transmitral pressure gradient rather than intrinsic diastolic function which can provide useful information in settings when the visualization of the IVC is limited.
To measure diastolic dysfunction, start by obtaining an apical four chamber, place pulse-wave doppler over the tips of the mitral valve leaflets, and transmitral velocity times can be measured (Image 2). Peak E wave velocity correlates with early diastolic filling rate, mitral annular e’ velocity reflects LV relaxation rate (Image 3), and both values are used to calculate E/e’ which correlates with left ventricular filling pressures.
According to the 2016 ASE guidelines, the diagnostic criteria of diastolic dysfunction is based on the absence or presence of preexisting cardiac disease:5
- septal e’ <7 cm/s or lateral e’ <10 cm/s (only in the absence of cardiac disease)
- E/e’ > 14
- left atrium volume index > 34 mL/m2
- peak velocity of tricuspid regurgitant flow > 2.8 m/s
This patient has risk factors for diastolic dysfunction, such as left systolic dysfunction and regional wall abnormalities. His E/A is above the cutoff of 0.8 (E/A 1.72), which is characteristic of normal or pseudonormal inflow pattern. The E/e’ is low, classified as having grade 2 diastolic dysfunction, and implicating that the mean LA pressure is elevated.
Limitations of diastology include tachyarrhythmias, mitral valvular disease, aortic regurgitation, constrictive pericarditis, incorrect angle of insonation (>20 degrees) of pulse wave doppler relative to mitral inflow and technical difficulty of obtaining images.5
Therapeutic measures such as positive end-expiratory pressure (PEEP) will decrease loading conditions (preload and afterload) on the left ventricle. Therefore, echocardiography can be valuable tool to guide management of ARDS by adjusting the ventilator settings and monitor the hemodynamic effects.
Case Resolution
The patient was started on broad spectrum antibiotics. He was admitted and transferred to the intensive care unit. Subsequently the patient required maximal ventilator support and nitric oxide.
One day later, transthoracic echocardiogram showed hypokinesis of anterior, apical, mid inferior and basal segments. The patient was evaluated by the Cardiology team, started on heparin drip and PCI was recommended once he becomes hemodynamically stable and ARDS resolves.
Four days later, the patient became bradycardic, went into asystole and deceased.
ACEP’s critical care ultrasound subcommittee has been working on advanced cardiac ultrasound educational cards to share with the community as a reference when performing critical care bedside ultrasound. Figure 1 is a graphical representation of how to perform basic diastology measurements. It is a useful tool to have when you need a quick reminder. Stay tuned for more to come from the group!
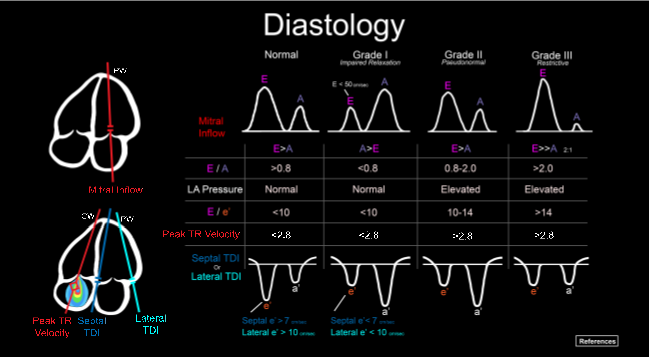
Figure 1. Illustration of an advanced cardiac ultrasound educational card on diastology.
References
- Dessap AM, Boissier F, Charron C, et al. Acute cor pulmonale during protective ventilation for acute respiratory distress syndrome: prevalence, predictors, and clinical impact. Intensive Care Med. 2016;42(5):862-70.
- Vignon P, Repesse X, Vieillard-Baron A, Maury E. Critical care ultrasonography in acute respiratory failure. Crit Care. 2016;20(1):228.
- Formenti P, Coppolar S, Massironi L, Annibali G, et al. Left ventricular diastolic dysfunction in ARDS patients. J Clin Med. 2022;11(20):5998.
- Nagueh S, Middleton K, Kopelen H, et al. Doppler tissue imaging: a noninvasive technique for evaluation of left ventricular relaxation and estimation of filling pressures. J Am Coll Cardiol. 1997;30(6):1527-33.
- Nagueh SF, Smiseth OA, Appleton CP, et al. Recommendations for the evaluation of left ventricular diastolic function by echocardiography: an update from the American Society of Echocardiography and the European Association of Cardiovascular Imaging. J Am Soc Echocardiogr. 2016;29(4):277-314.