Did you hear that murmur? No, but I saw it on ultrasound! - A Clinical Case of Aortic Stenosis
EUS Section Critical Care Subcommittee
Jeff Strojny, MD, Virginia Commonwealth University Health System
Lindsay Taylor, MD FACEP, Virginia Commonwealth University Health System
Case Presentation
A 70-year-old male presents to the emergency department after an episode of near syncope. He says he has been having shortness of breath when going about his daily activities, which is exacerbated with exertion. His symptoms have been worsening over the past two months, and earlier today he became dyspneic, lightheaded, and unsteady on his feet. His medical history is only significant for hyperlipidemia and hypertension which are well controlled with medication. On review of systems, he denies chest pain, palpitations, leg swelling, fever or cough.
His initial vital signs showed a temperature of 36.9° C, BP 138/90, HR 82 and SpO2 99% on room air. His physical exam demonstrated a well-appearing man in no acute distress. His lungs were clear, his heartbeat was regular, but a systolic ejection murmur was appreciated. When questioned further he did not recall ever being told he has a heart murmur. Initial lab work in the ED showed no acute abnormality. His ECG was interpreted as non-ischemic with signs of left ventricular hypertrophy. His chest X-ray showed mild cardiomegaly but otherwise no acute cardiopulmonary process. A point-of-care echocardiogram (echo) revealed left ventricular hypertrophy and severe aortic stenosis. The images of this patient’s bedside echo were not saved, but an example of moderate aortic stenosis on an apical 5 chamber (A5C) view are demonstrated using continuous wave (CW) Doppler over the left ventricular outflow tract (figure 1).
The patient was subsequently admitted to the cardiology service and had an inpatient transthoracic echo which confirmed the diagnosis of severe aortic stenosis. Due to his worsening symptoms, it was determined that his aortic stenosis had become critical and he underwent a transcatheter aortic valve replacement (TAVR). He was discharged 6 days later in good condition.
Education
Aortic stenosis remains the most common valvular disease in the developed world.1 A Cardiovascular Health Study found that 26% of patients >65 years of age have aortic sclerosis. Further, 2% of all patients had frank aortic stenosis.2 The presence of symptoms is an important demarcation point in these patients.3,4 Asymptomatic patients often have a very good prognosis, although those with symptoms have a mortality rate of about 25% per year. Symptoms typically consist or dyspnea, angina, heart failure and syncope.5 Diagnosis in the emergency department can be challenging because physical exam, ECG and chest X-ray are all quite non-specific.6 Ultrasonography remains the mainstay of diagnosis and can be of utmost importance in narrowing a diagnosis, especially in a critical patient.5
Point-of-care echo should focus on the overall dynamics of the left side of the heart, as well as quantitative measures of the left ventricle and left ventricular outflow tract. Initial assessment in parasternal long axis (PSLx), parasternal short axis (PSSx) and A5C will elucidate general heart function as well as evaluate the aortic valve (AV) for number of leaflets, thickness, mobility, and calcification.7 Quantitative measurements of aortic stenosis should include Peak Aortic Velocity (>400cm/s = severe aortic stenosis), Mean Transaortic Gradient (<40mmHg = severe aortic stenosis) and Aortic Valve Area (<1cm² = severe aortic stenosis).8 It is important to interpret these measurements with the clinical context of the patient because the severity of stenosis may be significant for one patient but less significant for another.8 An intercurrent illness can affect the cardiac output and influence the velocity and pressure gradients across the AV.8
ACEP’s critical care ultrasound subcommittee has been working on advanced cardiac ultrasound educational cards to share with the community as a reference when performing critical care POCUS. Figure 2 is a representation of aortic stenosis and its varying levels of severity. It is a useful tool when discussing a case with your consultants. Stay tuned for more to come from the group!
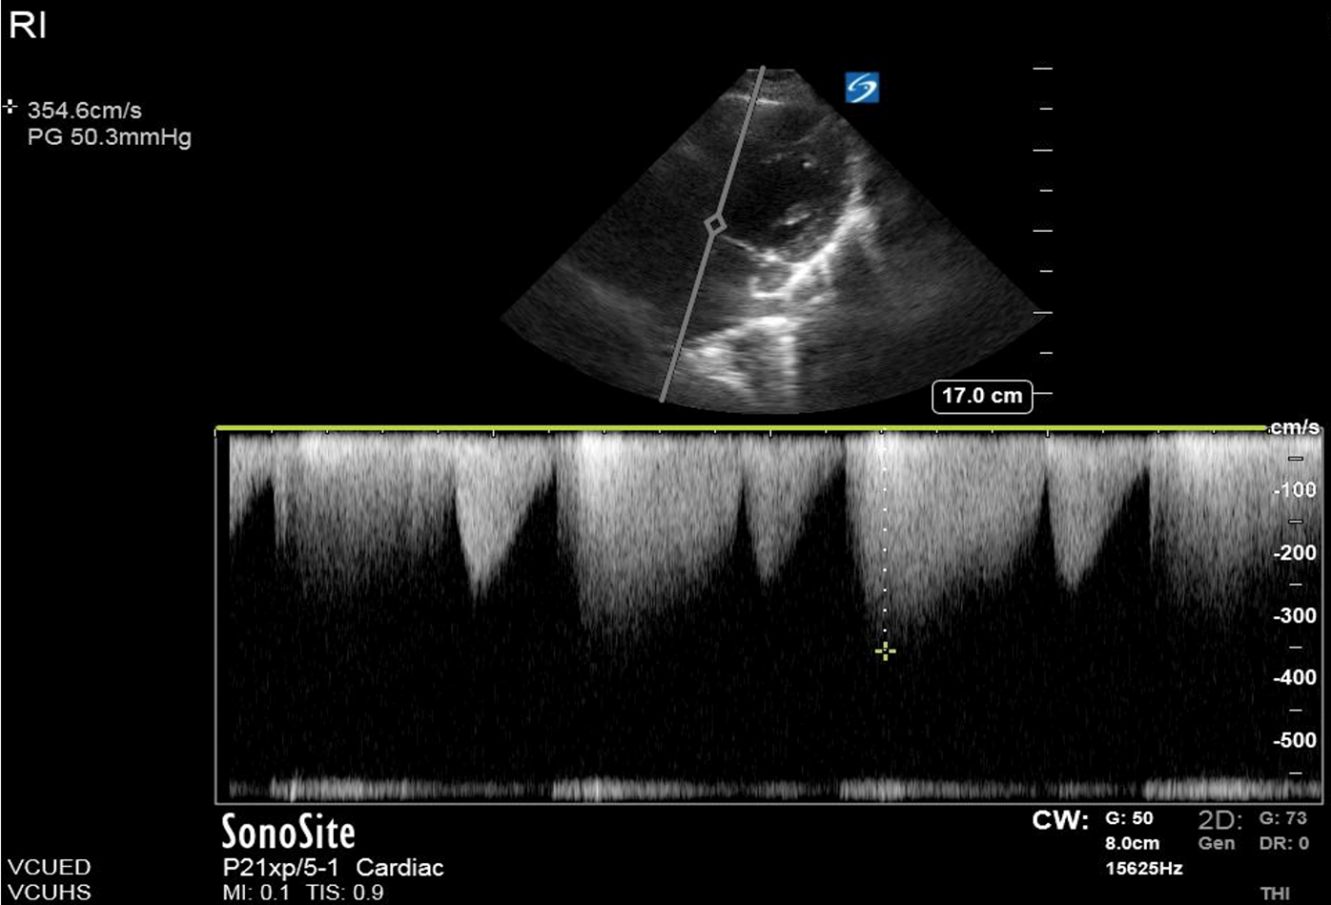
Figure 1. A patient with moderate aortic stenosis and peak aortic velocity at 354 cm/s.
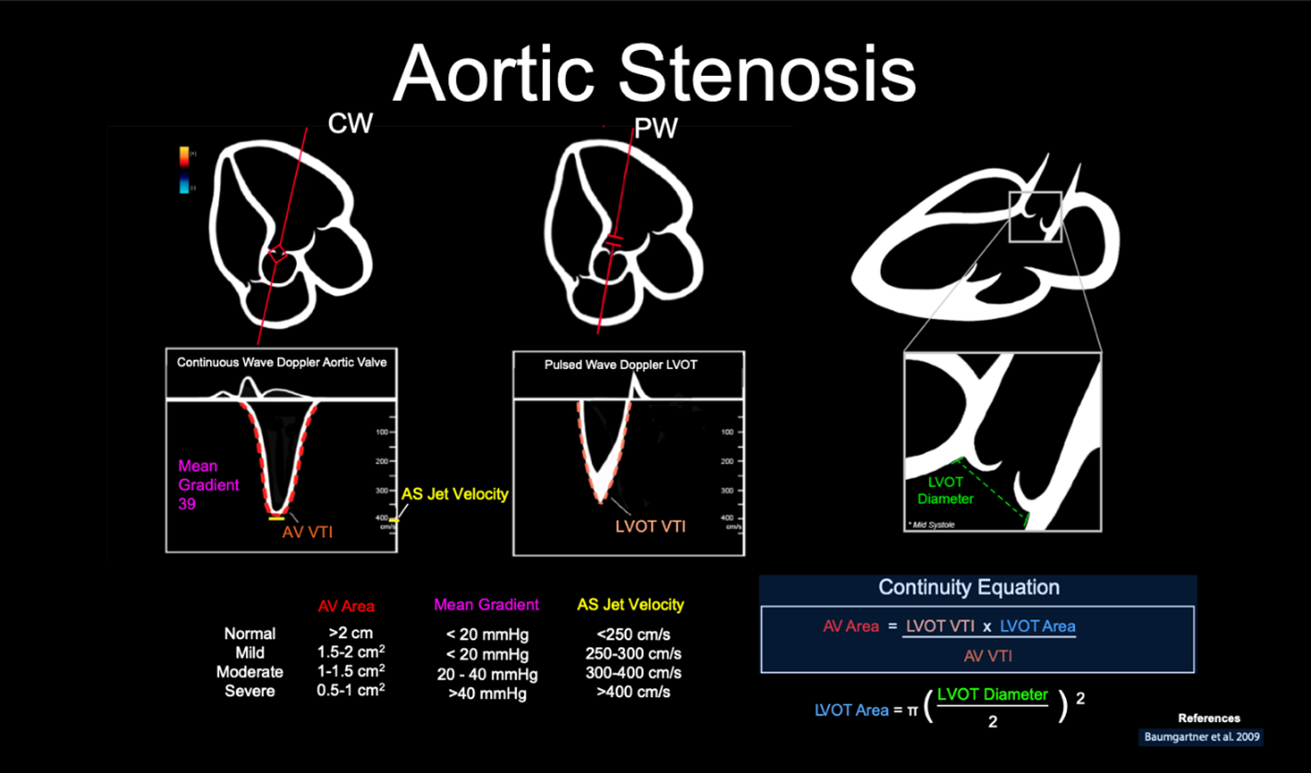
Figure 2. Illustration of an advanced cardiac ultrasound educational card on aortic stenosis.8
References
- Chen RS, Bivens MJ, Grossman SA. Diagnosis and management of valvular heart disease in emergency medicine. Emerg Med Clin N Am. 2011;29:801-10.
- Supino PG, Borer JS, Preibisz J, et al. The epidemiology of valvular heart disease: a growing public health problem. Heart Fail Clin. 2006;2:379-93.
- Ross J Jr, Braunwald E. Aortic stenosis. Circulation 1968;38:61-7.
- Nishimura RA, Carabello BA, Faxon DP, et al. ACC/AHA guidelines for the management of patients with valvular heart disease. J Am Coll Cardiol. 1998;32:486-588.
- Carabello BA, Paulus WJ. Aortic stenosis. The Lancet. 2009;373:956-66.
- Gardezi SKM, Myerson SG, Chambers J, et al. Cardiac auscultation poorly predicts the presence of valvular heart disease in asymptomatic primary care patients. Heart. 2018;104:1832.
- Resa E. Lewiss. “Practical Guide to Critical Ultrasound, Volume 1.” American College of Emergency Physicians, 2018. Apple Books. https://itunes.apple.com/WebObjects/MZStore.woa/wa/viewBook?id=1439354416
- Baumgartner H, Hung J, Bermejo J, et al. Echocardiographic assessment of valve stenosis: EAE/ASE recommendations for clinical practice. J Am Soc Echocardiogr. 2009;22(1):1-23.